Opportunity cost is defined as the potential benefit an investor misses out on when choosing one alternative over another. Every investor can likely think of an example of something that they once owned and sold at the wrong time or planned to buy and chose not to do so. Some of those examples can be quite frustrating in hindsight. However, in some cases, even what seems like the wrong decision may have still been the correct decision.
It’s never a good idea to make investment decisions based on where you were, rather than making decisions based on where you are. In financial planning investors are routinely faced with these decisions, even if you are not an active trader. Such examples can be something as simple as choosing to buy a car in cash versus financing a car purchase. Or, possibly whether or not you should pay off your mortgage or not.
Imagine a situation in which you had an investment portfolio of $200k that was averaging 7% annually. Simultaneously, you have a large cash position in the bank of $100k earning just 0.50%, with a mortgage balance on your home of $100k in which you are paying 3.5% interest. Simple math would tell us that you are better off investing that money at a 7% average return than keeping it in the bank or paying off the loan. However, depending on your personal situation, there may be more than one correct answer.
As an example, imagine you are closing in on retirement or already retired and by nature are very conservative. A portfolio that is averaging 7% annually is not necessarily going to guarantee such a return every year. It is a reasonable long-term assumption, but in the short term can be negative for several years. Committing capital to a portfolio may not be worth the volatility to you, particularly if the lack of a cash position will drive you to panic in the face of market volatility and sell your investments at an inopportune time.
So perhaps you should pay off the mortgage and save the extra 3%, which is the difference between the interest rate on the loan and the savings account rate. Well, this doesn’t always make sense either. Every investor should have an emergency fund of 6 months to 1 year of cash to fund their lifestyle. Without such liquidity, if you pay off your loan you won’t have the liquidity to address an emergency, and you may have to resort to selling assets such as your brokerage account that was averaging 7%. The unwritten rule of “Murphy’s Law” tells us that emergencies tend to come at inopportune times, and you may be selling investments at a low point in financial markets. Another possible issue is you may be forced to pay capital gains tax at an inopportune time.
Additionally, depending on how far into the mortgage you are, it may not make sense to pay it off. If you are 25 years into a 30-year loan, even though your interest rate is 3.5%, most of that interest was paid in the beginning, and you are now paying primarily principal. Paying off the loan at that point may not amount to much of a savings at all. Sometimes keeping cash on hand is the correct decision.
Even if your portfolio continues to earn very good returns, it doesn’t mean the correct decision is to commit all of your capital there. Investors have no control over, nor can they accurately predict short-term volatility with any degree of certainty on a consistent basis. Neither can the best of investment professionals. While the “would have, could have, should have” feeling may rest in the pit of your stomach, you may still have made the correct prudent decision.
Similar examples can made in terms of portfolio allocation. While a well-diversified portfolio is the prudent decision to fund your future as well as current retirement goals, we can all think of that example of a stock that you believed in, or just had a feeling about that could have made you an extraordinary amount of money. However, investors tend to remember the opportunity cost they missed that would have worked out well. That is where your regret comes from. We tend to forget the ideas we had and didn’t act on that would have ended catastrophically. Sometimes it’s the moves you didn’t make that are the best decisions you’ve made.
Financial planning is about having a strategic approach to achieving a set of goals that will take you from point A to point B with the least amount of risk that is necessary. This means that in the end, the correct decision isn’t always the one that yields the best outcome. The correct decision is the one with the most likely outcome of accomplishing your goals.
Filed under: Articles
Comments: Comments Off on Opportunity Cost: What it Means to You
In recent weeks there has been more and more discussion about the concerns of inflation. Inflation is defined as the general rise in the level of prices over a specific period of time.
Inflation has “officially” been reported at fairly low general levels over the last couple of decades by historical standards. We say “officially” because the formulas that determine price inflation have been altered over time to tell what appears to be a misleading story. The official core Consumer Price Index (CPI) has hovered around 2% annually in recent years. Alternatively, the one-hundred year average is closer to 3.25%.
However, prior to 1945 one such change was that prices were measured by what was called a “Cost of Living Index”. This method was determined by measuring the price of a fixed basket of goods with a constant weighting over time. As academic theories evolved, the methodology changed to measure what people were spending their money on by shifting the weightings to reflect these changes. Unfortunately, this tells you little about the cost of living. If a person buys less steak and more pasta because steak has become too expensive, this is a decline in the standard of living, yet still suppresses the appearance of inflation.
Even with the significant changes that were adopted in the 1980’s and 1990’s there was still inflation, but it has moderated over time, or at least the official CPI numbers create the appearance of a moderate inflationary environment. One aspect that has definitely contributed to a real reduction in the rate of inflation is the technology advancements in recent decades. This is particularly true since the invention of the internet, as it has become common place usage in our everyday lives and created a number of new efficiencies.
One aspect of inflation that is unavoidable is its relationship with the money supply. Simply creating money does not necessarily drive higher inflation. Increases in inflation require both an increase in the supply and velocity of money. The velocity of money is measured by the number of times a dollar is used over a specific period of time. The most broad and widely used definition of the money supply is the M2 money supply.
Since the early days of the pandemic outbreak until today, the M2 money supply has grown by more than 30% in total as a result of fiscal and monetary policy measures. That is an extraordinary and unprecedented increase. In comparison, the policy responses seen following the 2008 financial crisis essentially dumped vast amounts of money on the balance sheets of banks. However, there was no change to the trajectory of the broad M2 money supply because the money never made it to the hands of the general public. Hence, there was no noticeable movement in the rate of change in the official CPI data. This time we are seeing a noticeable uptick in the CPI data due to the large M2 increase. The concern is that this has only just begun.
The Federal Reserve chair has suggested that the increase in inflation is “transitory”. However, his language is rather ambiguous, most likely by design as to not get pinned down to any real prediction or critique of Fed policy. In fact, all increases in inflation are transitory. Whether this happens over a one-year or ten-year period, it is still transitory. The extreme inflation we witnessed in the late 1970’s and early 1980’s was “transitory” and at the same time extremely harmful to economic prosperity. It is not inevitable or necessarily even likely that inflation will be quite that high again. However, considering that Federal spending shows no signs of slowing, and is likely to accelerate rapidly, nor is there any sign of the Fed substantially slowing their open market operations of printing money and buying debt, it is not far fetched to assume that higher inflation may be here for some time.
As an investor, the ultimate question is whether inflation is a concern. The answer is yes, it is always a concern. The purpose of investing is primarily to keep up with and out-perform the risk of inflation. Those dollars which are uninvested and left in cash will ultimately be worth less because of inflation as it erodes your purchasing power. This is not to say that each investor shouldn’t have at least some cash on hand as an emergency fund.
Inflation is the hidden tax we all pay. Those that have few resources to acquire assets are punished the most. They own little to nothing and will pay more for those essential goods and services they must consume. Those with means to acquire assets will not suffer much at all, and likely benefit from the price appreciation over time in the assets they own. While greater inflation can come with a number of negative consequences to the real economy, always remember that the market and the economy are more like cousins than siblings. Investing your money is the best way you can combat the risks of inflation.
It is also reasonable to expect that greater inflation and any instability in the currency will lead to more volatility in markets. However, market volatility is the norm in the investing world. Volatility is not only to be expected, but the alternative in a higher inflationary environment is the false appearance of stability while your dollar value erodes.
Filed under: Articles
Comments: Comments Off on Inflation Concerns Heading into 2022
It seems as though nearly every conversation of late with an investment professional gets around to raising the topic of Bitcoin or some other alternative Cryptocurrency at some point in the discussion. As a result, it’s probably worth exploring the issue in a little bit of detail.
As a firm, we have chosen not to invest in such assets for several reasons, one of which is that we do not embrace the idea that crypto currencies are in fact even an asset in the traditional sense. At least not one with any intrinsic value, but rather more synonymous with a collectible. Let’s first touch on what it means to have intrinsic value as an asset.
Intrinsic value is what one might describe as an inherent value independent of any extraneous factors such as exuberance or panic in financial markets that might lead an asset to be priced at extremes. As an example, the value of a stock may see some highs and lows during any period of time. But if the company is profitable and maintains a consistent cash flow, it has some intrinsic value. If the company maintains assets such as inventory or real estate that is in excess of its current liabilities, then it has some intrinsic value regardless of market conditions or how the financial markets are pricing the stock.
The same can be said about a commodity. The price of gold, copper or silver can fluctuate dramatically over a period of time, yet all three always maintains some intrinsic value. They are used in the manufacturing of products as electrical conductors. Copper is used as a component in plumbing. Silver and gold are used for the manufacturing of jewelry, as well as other real world uses.
The correct price of any of these assets is constantly being debated ever day as buyers and sellers within the marketplace determine what they believe to be the correct price at a given point in time. This is what is referred to in economics as price discovery. However, at no point is it rationale to presume that there is no value in any of the aforementioned assets, as there is always some degree of value.
In the case of crypto currencies, there is a clear difference. A crypto currency has no cash flow, it has no earnings, it is not used to manufacture or produce anything of substance as it is entirely digital, and is not even an inanimate object.
Some would argue the same could be said about the US dollar since most currency exchanged in the modern world is little more than digital entries on a computer screen issued as fiat currency that is backed by no direct conversion into a tangible asset. However, there is one substantial difference. The U.S. dollar is issued with the full faith and credit of the U.S. government, which has the legal taxing power over the largest economy in the world. That means every product that is produced, and every service that is provided under the jurisdiction of the government gives the government the right to become your effective business partner by confiscating some of your productivity whether you like it or not. While we all hate to pay taxes, and actively work to mitigate that liability, it is a fact of life. This is expressly why the U.S. dollar holds more purchasing power than that of a currency issued by a 3rd world impoverished nation.
In its current incarnation one could argue that much of the secrecy that accompanies the transactions of cryptocurrencies that are exchanged between holders of these currencies that happens outside the prying eyes of government agencies is itself an intrinsic value. While we can think of a number of legitimate reasons why one might not want the government to invade your privacy and see what you do or don’t exchange your currency for, there are also a number of nefarious activities that can be hidden with this lack of transparency. As such, if you accept the notion that this is an intrinsic value, then you must also ask yourself how long the U.S. government and other governments around the world will allow such a market to exist without more stringent regulations. If you believe that to be the case indefinitely, which we don’t, then you have identified a permanent intrinsic value. Without such limited disclosure requirements and secrecy, it is hard to identify any other intrinsic value. In fact, we have already seen the U.S. government begin to crack down on some of these transactions requiring greater disclosure.
Another possible argument is the ease of international transactions without having to worry about currency exchanges. However, we still measure the value of something like Bitcoin in dollars, so the currency is still a factor if you wish to convert your Bitcoin into the currency of the nation in which you are domiciled whether that is a U.S. Dollar or a Mexican peso.
Due to that lack of a clear value, we do not feel comfortable exposing our clients to the risk of direct investment into crypto currencies at this time.
In time, perhaps our view will change as the crypto currency market evolves and reveals more benefits. However, as of now it appears to be an enormous amount of speculation built on a very shaky foundation.
Filed under: Articles
Comments: Comments Off on Cryptocurrency: What is the Value?
One of the more challenging financial planning concerns that often comes up is the concentration risk of too much money in a specific stock that has a very low tax basis. Investors are often torn between the risk of holding too much in any one company, and the potentially large tax bill that can come from realizing a large capital gain.
Sometimes this is a result of working for a company that has offered you stock grants or options as part of your compensation and has subsequently done very well. Sometimes it is simply the result of getting very lucky and buying a stock that had some exceptional gains. Either way, the this can present a tax dilemma. Since it’s generally not advisable to have more than 5% of your liquid net worth in any one company, its important to explore your opportunities to mitigate this risk.
Tax Loss Harvesting
Tax loss harvesting is a long-term approach of selling one holding for another in order to capture a tax loss on a position that has declined, or a dividend lot that was reinvested at a higher price in order to replace it with an investment that is similar, but not identical. As an example, selling an S&P 500 index fund at a loss in order to buy a Russell 1000 index fund. Doing this over time can capture losses that can be used to offset gains and slowly peel back a concentrated position without disturbing the integrity of the risk profile and allocation of your other holdings. Unfortunately, this will typically take a long time to generate enough losses to significantly reduce a large highly concentrated position with a big unrealized capital gain.
Hedging
The use of options can be applied in order to hedge out the downside of a concentrated position while you slowly reduce it over the course of many years. Strategies known as options collars can be implemented in which an investor purchases out of the money put options, while simultaneously selling out of the money call options can limit the downside and the upside at once. It is possible to do this at times with a relatively low cost. However, options trading is something that requires a high degree of expertise and understanding of the risks involved in order to execute a proper hedge. In some cases, if the position is large enough, there are investment firms that can create a specific structured product which can be tailored to a specific investor in order to help offload that responsibility when the investor doesn’t have the knowledge to hedge the portfolio themselves.
Exchange/Swap Funds
An exchange fund (not to be confused with an exchange traded fund), also sometimes known as a swap fund is a product offered to investors by large financial institutions that is essentially a partnership that invests in a diversified portfolio of stocks that track to a benchmark, not unlike a typical mutual fund. However, they are designed to be funded with a stock holding that you transfer to the fund along with your lower cost basis, and in exchange you receive a proportionate amount of the same value of this diversified fund with the same cost basis. While you still have the same problem of an unrealized capital gain, you no longer have the risk of a concentrated position.
This strategy comes with its disadvantages. One is that you often have to maintain the fund for as long as 7 years, so you don’t have the same degree of liquidity. However, if you were going to keep the stock holding, or otherwise invest it in something more diversified, it becomes an insignificant difference. Another issue is that you have internal expenses to buy the equivalent of an index fund that are more typical of a managed mutual fund. The cost to buy an S&P 500 index fund might ordinarily be 0.03%, while the cost of an exchange fund might run 0.80%-1.00% annually in internal expenses.
Additionally, these funds often pay you only the price return of the underlying index, and not the dividend income, so you sacrifice some of the upside for the immediate diversity. Such funds require that you deposit a large position, often $500,000-$1,000,000 in value. It is also typically necessary that it’s a holding that is widely held and fairly liquid. Exchange funds would most often not offer this to a new issue, or a thinly traded company.
Overall, these are a few common strategies available to reduce concentration risk in cases where taxes are a consideration and a significant liability. It’s important to examine these situations from the perspective of your longer-term financial plans, and the risk reward of holding a concentrated position. Oftentimes investors feel emotionally attached to a company because they made a lot of money with the stock, or they worked there. Emotions and investing are an unhealthy combination. It’s important to try and be objective as you possibly can.
Other times investors who worked for a company feel a sense of confidence because they feel they have a better understanding of how the company is doing from the inside. Unfortunately, sometimes this is an unfounded overconfidence. Lehman Brothers was a more than 180-year old investment bank, and one of the most powerful institutions in the world, and they imploded in a couple of weeks. One can never be sure, and the safety and protection of a diverse portfolio compared to any one company cannot be overstated.
Tax considerations are an important part of the portfolio management process. However, it’s also important not to let the tax tail wag the investment dog too much. Some of the strategies referenced can be a reasonable middle ground to addressing the tax concerns of a large gain in a heavily concentrated position.
Filed under: Articles
Comments: Comments Off on Addressing the Tax Concerns of Concentrated Stock Positions
Not long into the 2008 financial crisis, the Federal Reserve among other policy responses dropped short-term interest rates to zero. After nearly a decade of anemic economic growth, we finally started to see enough economic activity that the Fed began increasing rates. Unfortunately, as we all know the government lockdowns caused a severe contraction to GDP and forced the Fed to reduce rates back to zero yet again. All of this has resulted once again in limited savings options for the average American.
A savings account is never a great long-term investment option. However, it’s imperative that all investors maintain some degree of short-term liquidity for emergencies. In general, it’s a good idea to have at least six months to one year of an emergency fund so you don’t have to liquidate a longer-term investment option at an inopportune time.
Money Markets & Savings Account
Historically money markets offer savings rates that have been higher yields than a typical savings account at a national bank. Unfortunately, in the current environment most money markets offer nominal interest rates not much better than a typical savings account. One option that offers some improvement can be found in the online banking space. The lack of “brick and mortar” costs associated with online banks will often lead to interest rates that are more competitive than a larger national bank found on every corner in the nation. Traditional savings and money market accounts are useful when it comes to fulfilling the need for an account that will require day to day liquidity. It’s also important to understand that not all money markets are FDIC insured. Since a money market is technically a mutual fund, it is possible for the fund to “break the buck” and pay back less than $1 per share. While this is very rare, it did happen in 2008.
Certificates of Deposit
CD’s are still a viable option as a short-term savings vehicle. While the rates may not always seem that much more attractive than a typical savings/money market, they may still make sense. If you likely have no need to spend down cash other than an unforeseen emergency, then a CD may still make sense. Even if you need to lock in a CD for 3-5 years, typically the only penalty you would incur should you need to break it would be the loss of the interest that you would have earned. There is generally no risk to your principal as long as you stay within FDIC limits.
Short Term Bond Funds
An ultra-short term bond fund comprised of very-high credit quality is not a savings account. However, they typically come with very nominal downside risk for the investor who doesn’t have any known short-term needs. It’s important to pay close attention to credit quality, as a short-term bond fund in an extreme market downturn can see noticeable short-term losses. While these declines are unlikely to look anything like the declines seen in equity markets, they can be impactful. At the height of the market panic in late March of 2020 it was not uncommon to see a 5%-10% decline in short-term funds that took greater credit risk. One clear indicator is the yield of a fund. If the yield is noticeably greater, then more than likely its worth looking closer at the credit rating of the issuers the fund is buying. In contrast, most short-term funds of very high-quality debt actually appreciated as the markets plummeted in March of 2020.
Annuities
Many of us have had the local bank teller notice a large cash position and encouraged us to speak to the local investment professional at the bank. One such option they will propose is what is known as a Single Premium Deferred Annuity (SPDA). The SPDA is an insurance contract that functions much like a CD with no fluctuations to your investment principal. They are not insured by the FDIC, but rather backed by the insurance company, and sometimes further backed by the state insurance commissioner’s office up to certain limits.
The advantage of the SPDA is that they sometimes offer rates that are a little better than a CD, and the interest is tax deferred. Once they mature, the contracts usually have a floor interest rate that you can continue to collect without exchanging into a new annuity. At times those interest floors have been attractive compared to current market rates.
The disadvantages are they don’t typically permit you to break the contract penalty free. What you can often do is withdraw a percentage of the contract, sometimes 10% per year without penalty. There is also a penalty on withdrawals made before age 59 ½, so it’s not a suitable option for those younger in age.
Credit Risk Caution
One area to be very cautious is in the floating rate space. Floating rate notes are extremely short-term corporate debt that is only available to institutional buyers. However, a number of mutual fund companies offer floating rate funds that buy such paper and offer more attractive yields. A quick look at a chart of most floating rate funds will show price changes that are typically between 2%-3% principal fluctuation during positive or negative market changes. During the 2008 financial crisis when the credit markets came to a near total freeze, these floating rate funds saw average declines of -27%. This is an area that is often mistakenly looked at as a short-term cash position. We would caution against such an approach. Floating rate securities can be an attractive investment at times, but any vehicle that offers substantive credit risk is not an ideal savings alternative.
When it comes to an emergency fund, it’s important to remember that the goal is stability at the best interest rate available with a reasonable amount of liquidity, and not to become too frustrated with the low returns currently available. Emergencies often happen during periods of great market volatility. What you don’t want is to find yourself in a position of having to sell a quality asset at a depressed price, therefore eliminating your ability to benefit from an eventual price rebound. Maintaining a proper emergency fund should actually provide you with more comfort in your ability to take greater risk with your other investment accounts with the knowledge that the short-term risk has already been addressed.
Filed under: Articles
Comments: Comments Off on Savings Options in a Near Zero Interest Rate Environment
Value stocks vs Growth stocks, which is the better investment? The debate between value investing as opposed to growth investing is an ongoing one. Which is better depends on from which point in time you ask the question. It’s first important to understand what the difference between the two investment categories are.
Value Investing
A value company is one that generally trades lower than its underlying fundamentals suggest that it should be trading at compared to the market or its sector. They often have higher dividend yields, and trade at attractive (lower) price to earnings ratios (P/E).
Growth Investing
Growth stocks are companies that have an expectation that they will grow faster than the average rate of growth for the market. They typically demonstrate characteristics such as sales and earnings growth that is outpacing the rest of the market or their sector. They will normally trade at an elevated price to earnings ratio, and generally pay either no dividend income, or have a nominal dividend income compared to the overall market or sector.
Different market cycles have favored value or growth at different times. Since about 2008, coming out of the financial crisis, growth stocks have been favored over value in most years. Investors have favored these more expensive companies.
An example of a value stock in todays market would be a company like Johnson & Johnson (JNJ), which pays more than a 2.5% dividend, but is not expected to have the same rate of growth as a company like Alphabet (GOOG); aka Google, which pays no dividend and is considered a growth stock.
Using the ten-year period ending on June 30th 2020, the ten year return for the S&P 500 Growth Index was 16.36%. During the same period, the return for the S&P 500 Value Index was 10.69%.
However, this cycle is not perpetual. Over the last 40 years, when the gap between the more expensive growth stocks and the more conservative value companies tends to widen, the cycle typically reverses. After the great tech bubble implosion that began in March of 1999, the cycle reversed and from 2001-2003 value stocks outperformed.
During the 25-year period between 1990-2015, value stocks were favored. The returns were as follows:
The S&P 500 Growth Index returned 8.72%
The S&P 500 Value Index returned 9.58%
On an annual basis, value outperformed growth 69% of the time over that same 25-year period, providing for less overall volatility. This data was similar across large cap, mid cap and small cap indices as well.
Trying to determine when the cycle reverses is essentially a form of market timing. However, it’s not much of a secret that the recent breakout from the bottom of the market in March of 2020 has been led by a relatively small group of growth stocks that have substantive weighting in the S&P 500. This may mean that it is time for value companies to catch up. Perhaps it means that the cycle will continue even longer. One can never be certain.
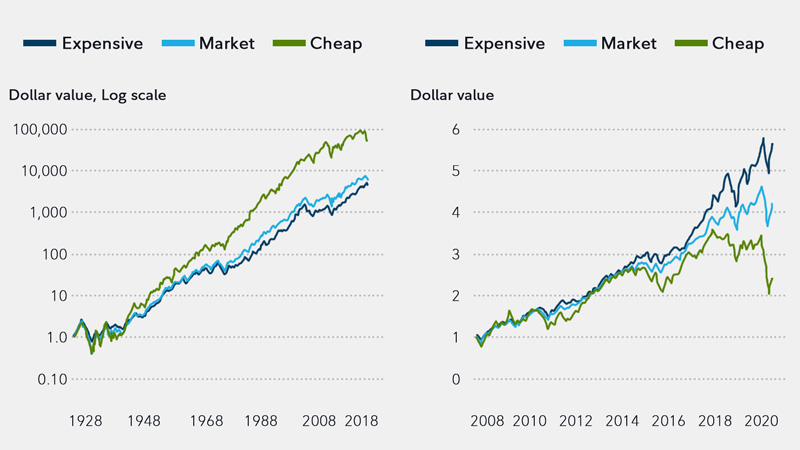
If we look at recent pricing on a price to book value ratio, the difference is significant. During the period ending June 30th 2020, the differences are as follows:
The S&P 500 traded at 3.5 times its book value.
The S&P 500 Growth Index traded at 7.4 times its book value.
As we can see, growth stocks have already had quite a move upward by comparison.
A look at the chart above provided by Fidelity Investments, which cites data from the University of Chicago’s Booth School of Business illustrates how over the longer term, stocks priced cheaply tend to have better long run performance. The same chart illustrates how this has not been the recent trend over the last decade. More specifically, since 2014 the disparity has been rather pronounced. In this illustration, stocks are broken down by the most expensive quintile, and the least expensive quintile as measured by both price to earnings and price to book ratios.
Looking purely at return is never the sole answer either. Investments should be looked at on a risk adjusted basis. In simpler terms, how much more risk is needed to increase overall returns. Generally speaking, it is fair to say that value companies tend to introduce less volatility into a portfolio than their growth counterparts. This has been the case through most market downturns. We saw this play out during the market correction at the end of 2018.
However, the recession and market decline induced by the coronavirus threw many of the historical norms out the window. Society became extremely dependent on the use of remote technology as citizens were on lockdown, favoring the services offered by the technology sector, which makes up a very big part of the large cap growth space.
Time will tell as to whether or not we are about to see a reversal back into value driven companies in the short term. We generally favor a slight bias in most portfolios toward value companies as a method to reduce volatility and enhance longer term returns over short term volatility. This is especially important for retirees, or those closing in on retirement, as they often depend on some form of income from their portfolios. However, the overall core holdings are a blend of both value and growth across all market caps. Any attempt to time value vs growth on an absolute basis can result in missing a significant market move.
Filed under: Articles
Comments: Comments Off on Value vs Growth: Which is Better?
When questioning your rate of return, the answer seems like a simple one to a simple question. However, like most financial matters, the answer is never as simple as it seems. There are actually various ways in which the rate of return of an investment is measured.
One such method is what is called the Time Weighted Return (TWR). This is a method most commonly used by mutual funds when quoting the performance of the fund. This method measures the performance of a specific investment over a specific period of time. This is used by investment companies because the manager of a mutual fund has no control over when investors will choose to withdraw or add money to their investment fund. Depending on when your personal transactions occurred, you may see a different return than what is quoted by the investment company.
Another method is the Internal Rate of Return (IRR). This method is designed to take into account the impact of cash flows either in or out of the investment fund(s). This is a better representation of your actual experience based on when you added or subtracted funds. This is also sometimes called a Money Weighted Return (MWR).
Which method should be used?
That depends on what you wish to measure. If your goal was to evaluate how well you or your advisor selected a set of investment vehicles relative to other options, you would likely use the TWR method. The reason is that short term market volatility may have a significant impact on short term results. If two separate investors allocated dollars in the precise same percentages to the same exact investments, but one began in January of 2020, and the other in April of 2020, the results are vastly different by August of 2020. Due to the fact that financial markets saw a steep selloff in the midst of the Coronavirus lockdowns, the outcome for the exact same strategy is wildly different in such a short duration of time. One investor may look foolish, while the other may appear to be a genius, yet they did the exact same thing just a few months apart. Neither is true, as the difference is little more than luck over such a short duration of time.
If you were trying to measure the performance of your 401k plan as you were saving for retirement via your bi-weekly contributions, you may have been recommended a growth-oriented asset allocation. It’s not uncommon for someone to be told that their asset allocation has had a rate of growth of 8%-9% over the last 10 years. However, when they look at their actual return, it may be closer to 7%. This is a function of the IRR/MWR.
If you think about this in simple terms, the stock market is up 75% of the time. This means that 3/4ths of the time you are paying more for the same investments every two weeks. If done over a forty-year career, you paid quite a bit more in year forty than in year number one. The same would be true even over a ten-year time frame. That means your personal return over all those years of saving will most certainly be lower than the actual return of those investments over that same time frame. This is not a reason to avoid investing, but it rather demonstrates the importance of starting early. The younger you are when you begin to save, the less total assets you need to save to achieve the same result.
In such an example, if you wanted to see how well you did in in your 401k terms of investment selection, you’d use the TWR. If you wanted to see your actual result in order to track your personal progress towards your retirement goals, you’d use the IRR/MWR. The same is true in the example of an investor withdrawing funds to supplement an income stream. The periodic cash flows withdrawn will inevitably alter their rate of return over time.
Neither of these methods is good or bad. Instead it’s just important to understand which question is being asked, which isn’t always clear, in order to answer the question with the best possible answer.
Filed under: Articles
Comments: Comments Off on What is My Rate of Return?