Every year or two since 2001, there are annual increases to IRA contributions that are adjusted due to inflation. However, IRA contributions are not the only thing that is adjusted for inflation. Many components in the tax code are adjusted that can impact various aspects of retirement planning.
Some of the important new limits and phaseouts are as follows:
RETIREMENT PLANS
IRA & ROTH IRA-contribution limits are increased to a maximum of $6,500 ($7,500 if over age 50).
The deductibility phaseout for IRA contributions for those with a retirement plan at work should increase for singles to $73,000-$83,000 in 2023, and for those married filing jointly to $117,000-$137,000 in 2023.
The direct contribution limit phaseout will increase to $138,000-$153,000 in 2023 and for those married filing jointly to $218,000-$228,000 in 2023. If your Modified Adjusted Gross Income-MAGI is above that, you’ll need to contribute indirectly via the backdoor conversion process if eligible. Some info regarding backdoor conversions can be found here:
SEP IRA-contribution limits will increase to $66,000 per year for 2023.
SIMPLE IRA & 401k-contribution limits will increase to $15,500 in 2023.(Employees over age 50 are entitled to an additional $3,500 catchup contribution).
401k & 403b–EMPLOYEE contributions will increase to $22,500 in 2023 ($30,000 if over age 50).
401k & 403b–TOTAL contribution limits with EMPLOYER matching will increase to $66,000 ($73,500 if over age 50).
457-contributions will increase to $22,500 in 2023. (457 plans can have unique catch-up contribution rules, so consult with your plan administrator about your plans limits).
401(a)-the compensation limit (the amount of earned income that can be used to calculate retirement account contributions) will increase to $330,000 in 2023.
(This is typically 5X the maximum 401(k) plan total contribution limit).
Defined Benefit Plans-415(b) limit for maximum annuity limit will increase to $265,000 in 2023. (The highly compensated employee definition will increase to $150,000 in 2023).
Some other important changes are:
Flexible Savings Accounts-FSA contribution limits will increase to $3,050 in 2023.
Health Savings Account-HSA’s for single people, the contribution limit will increase to $3,850 in 2023. Family coverage will increase to $7,750.
Social Security-benefits will also increase by 8.7% for 2023. The maximum possible Social Security benefit for someone taking benefits at age 70 for the first time will be $4,559 per month.
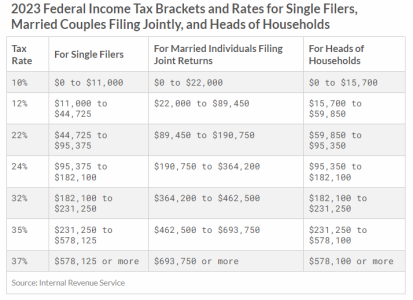
Additionally, the IRS updated the 2023 income tax thresholds to adjust for the impact of inflation. A breakdown on the marginal tax rates are as follows:
These are just a few important retirement planning and tax updates. It’s also important to note that other aspects of the tax code can and will change as well. That can include things such as the child tax credit and various other items that may have a substantial impact on you. It’s important to consult with both your financial advisor as well as your tax advisor to see how these changes may impact you.
Filed under: Articles
Comments: Comments Off on 2023 Tax & Retirement Plans Update
In recent weeks we’ve heard more and more talk of the U.S. entering into a recession. As expected, many investors are concerned about the implications of a recession on their investment portfolio. In order to understand what might happen in the future, it’s helpful to look at what has happened in past recessions.
Recessions happen approximately every five years or so. However, they do not necessarily happen in a linear fashion with every fifth year turning negative. They are more random than that. Sometimes they can be grouped more than one within five years, and sometimes it can be more than a decade before the next recession.
What is a recession? Well, historically the textbook definition of a recession was generally defined by two consecutive quarters in which the Gross Domestic Product (GDP) of the United States contracts rather than expands. GDP is a measurement of overall economic activity. After the 2008 financial crisis, the National Bureau of Economic Research (NBER), a private non-profit group re-defined the definition of a recession as a “significant decline in the activity spread across the economy, lasting more than a few months”. NBER somehow became the official arbiter of what is or isn’t a recession. The U.S. has now officially seen two consecutive quarters of negative GDP growth in the first two quarters of 2022. It remains to be seen if this is the first time in history in which GDP has contracted for two quarters, and we are not in an “official” recession according to the NBER.
A recession can be triggered due to numerous things such as fiscal or monetary policy mistakes, and/or non-economic exogenous shocks to the system, such as the 2020 lockdowns, or the 9/11 attacks.
More importantly, the question is what is the impact to the investor, and the public in general? As it pertains to financial markets, the good news is that the market tends to serve as a discounting mechanism. This means that the market is attempting to anticipate good or bad news before it becomes a known certainty.
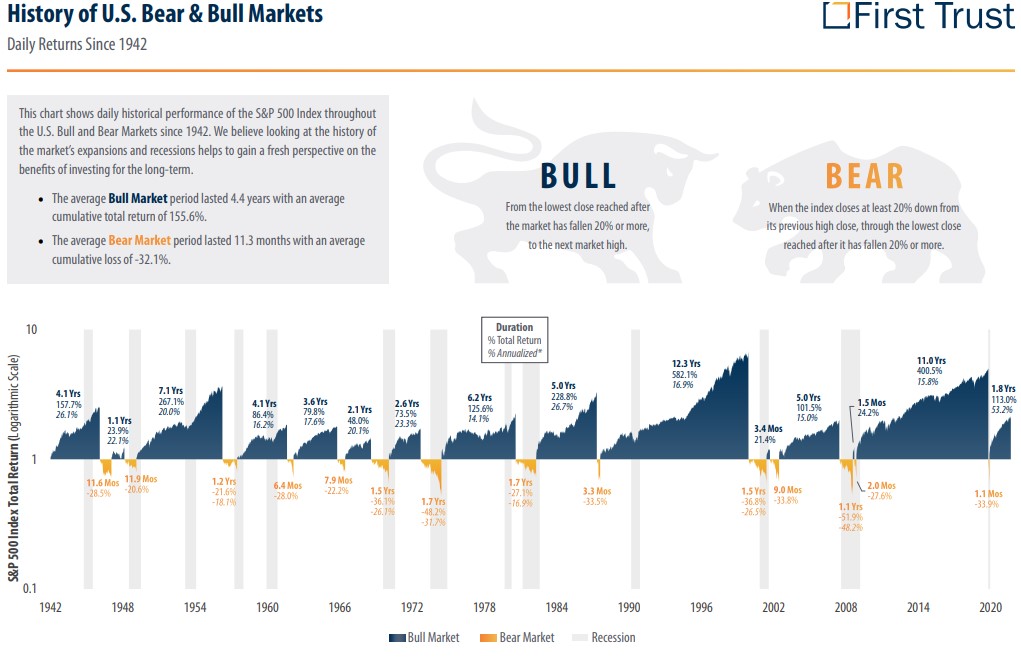
As we can see from the data above provided by First Trust Advisors LP, more often than not the market decline precedes the recession. This would likely explain the negative start to 2022 that put financial markets into “Bear Market” territory, which is generally defined as a 20% or more decline in the market.
There have been times when the market has declined by 20% and a recession did not follow, though that is less common. There have also been recessions that didn’t see a 20% decline preceding the recession. What we can also see from the data above is that the average bear market lasts only about 11.3 months, while the average bull market lasts 4.4 years.
We can also see that most often the market recovery begins before the economic recovery. Based on the historical data above, there is an excellent chance that the majority if not all of the recent decline that has preceded this current recession may already be done. This is not a certainty, because we can never tell for sure how deep and long lasting the recession will be. It’s entirely possible that the third quarter may also be a negative quarter for GDP. It’s also possible that this can be an extremely short-lived recession, not unlike 2020. However, regardless of the depth and length of the recession, it is highly probable that the markets will have recovered long before the economy has recovered. This is what makes market timing so difficult, and precisely why we don’t endorse such an approach.
If the U.S. slides further into contraction, there could be more downside left to stock prices below the recent lows. If the recession is short lived, then we have probably seen the bottom of this recent downturn. It’s also important to note that this recent market downturn will not be the last, nor will this be the last recession. If you are a 65 year old that recently retired, you could very well live another 30 years into retirement. This would mean that statistically you would be likely to see about six more recessions in your lifetime, and probably many more market corrections along the way.
In an economic sense, while the market tends to recover first, the economy usually lags somewhat. This is why data points such as unemployment figures tend to be a lagging indicator of economic growth. The layoffs don’t generally start to any significant extent until the slowdown is present and demand declines. So peak unemployment in the business cycle is usually at the end of the recession, or when the recession has already ended. In fact, when a recession is short lived and confined to just two quarters, you sometimes don’t officially know you’re in a recession until it’s already over.
We cannot say with any degree of accuracy if this will be a prolonged recession, and frankly, neither can the “experts”. Let’s remember that entering the summer of 2021 the vast majority of economists believed that inflation was “transitory”. We were a bit more concerned about inflation and believed this to be a longer lasting problem that will still likely take at least a couple of more years to fully work through. Coming into 2022, very few economists were predicting a recession, with most believing that we would not slide into negative GDP territory until 2023 at the earliest. Yet here we are in a recession with the “experts” being wrong yet again.
The economy is a massive financial eco-system in which millions of possible variables impact millions of possible outcomes. More often than not, “expert” opinions about the short term are ambiguous and generally not very helpful as it pertains to investment decisions. When it comes to making short term predictions, we would suggest that there are no experts. As it pertains to managing money, we take a long-term strategic approach to investing using proper asset allocation to address risk management and avoid market timing. The markets have shown they are remarkably consistent over the long term. However, in the short term, it’s important that you know enough to know, that you just don’t know.
Filed under: Articles
Comments: Comments Off on What Does a Recession Mean for Investors?
Considering the recent high inflation environment where the March 2022 CPI figure was 8.5%, and in 2021 the average inflation was 4.7%, savers have rightfully so been looking for a safe place to put their money where its purchasing power doesn’t get eroded from the effects of inflation. To make matters worse, savings rates on money markets and 1 year CD’s are 0.60% and 1.35% respectively, meaning savers are losing purchasing power after inflation is taken into consideration. There are other options of course that historically have kept up with inflation but it comes with additional risks, such as stocks, commodities or real estate. So, what is a conservative saver to do?
One option that has recently been in the headlines are Treasury Savings Bonds called Inflation Bonds (I Bonds). I The recent attention is a result of the current interest rate paying 9.62%! So, what are I Bonds? Think of savings bonds that you would get for a birthday or a holiday gift which you buy at half the face value, and they mature at face value at some future date. They were issued in series such as Series E or EE bonds, which was on the front of the bond. Many of us still have them in the safe deposit box.
I Bonds by comparison were created by the Treasury Department back in 1998 to help savers keep up with inflation. The Series E or Series H savings bonds accrue at a fixed interest rate. Therefore, if we have high inflation, the purchasing power of your savings is eroded if the inflation rate is higher than the fixed rate. I Bonds were designed to have an interest accrual adjustment as well which is explained below. Due to the fact that they are issued by the government they are safe, with interest and principal guaranteed by the United States. They have a 30-year maturity, after that, they stop accruing interest.
Bonds can be bought at TreasuryDirect.gov or using your Federal Tax Return. When bought online, they are electronically held at the Treasury. The minimum purchase starts at $25. You can buy in any dollar increment right down to the penny. They are issued in paper if you buy them through your federal tax return. You can buy them by filing Form 8888 along with your return and the refund will be used to purchase the paper bond. The remaining portion of your refund will be sent to you. The paper bond is sold in denominations of $50, $100, $200, $500 or $1,000.
The rate of an I bond is composed of two parts, the fixed part and the variable part. The fixed rate is determined at the time of purchase and remains the same throughout the life of the bond. The fixed rate on new bonds is determined by the Treasury every six months, which is based upon their borrowing needs and current market rates. The second part, the variable rate is based upon the non-seasonally adjusted Consumer Price Index for all Urban Consumers (CPI-U), including food and energy. The rate is set every 6 months on the first business day of May and November. The change is applied to your bond on the bonds issue date. If you bought a bond in January, then the change is reflected in January, not November and then runs for 6 months. The interest is earned every month and accrued every six months. Therefore, the interest accrued from the past 6 months is added to the bond and you start earning interest on the prior months interest. The principal and interest are paid to you when you cash in your bond.
Currently, the fixed rate is 0.00% but the current variable inflation accrual rate for May of 2022 through October 2022 is 9.62%! That has been the recent attraction to these type of savings vehicles because of the high accrual rate. There are caveats one should consider before going out and buying I Bonds for your portfolio.
First, there is a maximum purchase amount that they Treasury allows, which is $10,000 per calendar year. You can buy an additional $5,000 per year via your Federal Tax Return. If you wish to buy them on behalf of others, there is no maximum number of people for whom you can do this. For example, if you want to buy for multiple grandkids, you can purchase $10,000 for each grandchild, and an additional $5000 per grandchild via your tax return. The owner is determined when you buy them and who they are registered for, such as a grandchild.
Next, as noted earlier, I Bonds have a 30-year maturity, so they stop earning interest after 30 years. However, you can cash in your bonds after one year. It’s important to note, if you cash in your bond before 5 years, you will have a penalty of the last 3 months of interest. Given the one-year hold requirement and five-year interest penalty, buying savings bonds should be thought of as longer-term commitment as opposed to putting your emergency fund into I Bonds.
Taxes are due on the interest when the bonds are cashed in. They are federally taxable but state and local tax free. The tax form, which is a 1099 will be sent to you from the institution you cashed them in with. If you redeemed them through Treasury Retail Services, they would issue the 1099. If you redeemed them through a financial institution, they would issue the same tax document.
There are additional considerations when thinking of adding I bonds to your holdings such as the opportunity costs. Recall that the fixed rate is currently zero. Before the recent inflationary environment, rates and inflation for the past decade had been very low. This meant that the rate was zero on the fixed rate as well as the variable inflation rate. Should inflation moderate, it’s possible that you could have a much lower rate of return. As a result, you should consider what other options may provide a better overall return during the duration of time you plan to commit your money.
As you can see, there are several considerations to make before adding I bonds to your savings strategy. As always, diversification is key to a well-constructed investment strategy. If I Bonds make sense for you then they can serve as another conservative portion of an overall financial planning strategy. If you have additional questions, feel free to reach out us to see if you should consider I Bonds for your financial plan.
The best place for additional information is TreasuryDirect.gov which provides FAQ’s on I Bonds and other government debt instruments.
Filed under: Articles
Comments: Comments Off on I-Bonds: What Are They, And Do They Make Sense?
Market volatility is something that can cause investors a great deal of stress. Losing money is something that nobody enjoys. Yet we all enjoy making money when assets prices rise. Paul Newman’s character “Fast Eddie Felson” in the 1961 film “The Hustler” reprised in the 1986 film “The Color of Money” once said that “Money won is twice as sweet as money earned”. There is probably some truth in this statement, as people tend to really enjoy watching their portfolio go up during strong market environments. However, experience and research shows us that losing money is more stressful to the average investor than the pleasure they gain from making money on their investments.
Psychologist Daniel Kahneman’s 2011 book “Thinking, Fast and Slow” examined how people react to losing money. What he uncovered is that most people are about 2.5 times more concerned when they lose money versus when they make money. This research was very consistent with what we have observed in the financial services industry over the last several decades.
Unfortunately losing money is something that happens in more than one way. We would argue that there is no such thing as a riskless investment. Among the ways you can lose money, some key ways would include:
Principal Risk
Interest Rate Risk
Credit Risk
Inflation Risk
Principal Risk
It’s no surprise to most people that if they buy a stock or a stock fund, they could lose money. Investing in a single stock can lead to a total loss, as many companies have gone bankrupt and ceased to exist. Investing in a well-diversified stock fund mitigates such a risk of a total loss to the point of near zero, unless markets cease to exist. Given enough time, the diversified approach has always worked. However, in the short-term, principal risk is always a possibility.
Interest Rate Risk
If you were to buy a fixed income investment such as a government bond, corporate bond, or even a CD, you run the risk that rising interest rates can make your investment worth less. The longer the maturity of the fixed income investment, the more interest rate risk you take. Imagine owning a bond that matures in ten years that was paying you 3%. Then the interest rate environment changes and short-term rates rise to 4%. Nobody wants to buy your bond at 3% and wait the remaining years to get their money back when they can get 4% in something shorter term. If you want to sell your bond, you’ll have to take a loss to account for the interest rate change. If you hold the bond until it matures, you’re losing 1% annually, which is the difference in what you could be making if you had the cash to invest now and weren’t tied to the original bond you bought.
Credit Risk
When you buy the bond of a corporation, private mortgage portfolio, or in some rare cases local municipalities, there is always the risk that one of these entities could default on that debt. This is what we call credit risk. In the event of a default due to a corporate bankruptcy, bond holders in a corporation have a higher position than stockholders. In some cases they are awarded stock in the new entity that emerges from bankruptcy. This is not always the case, and sometimes the loss is a total loss.
Inflation Risk
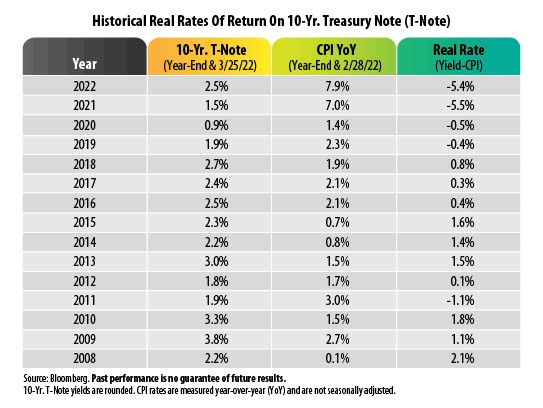
Inflation risk is something that is being more frequently talked about today, as we are now seeing inflation at levels not seen in 40 years. As an investor, buying a US Treasury provides you with what is often referred to as the benchmark for a risk-free return. This theoretical risk-free return is based on the premise that you can hold your treasury to maturity, and there is no credit risk with a US Treasury, therefore you’ll eventually get your money back. This line of thinking ignores not just the interest rate risk mentioned previously that is always present in fixed income investments. It also ignores the inflation risk that is always present to some degree or another. No matter the investment vehicle, there is always a rate of inflation that this must be measured against.
Looking at the chart above provided by Bloomberg, you can see that the net return on a 10-year US Treasury note year over year since 2008 has produced five separate years in which the net return after inflation is a negative return. That’s 1/3rd of the time in the last 15 years the real return (net of inflation) was negative.
What this illustrates is that the safest investment isn’t always so safe.
Simple math tells us is that if an investor were to have an average annual return of 7% on their investments, before inflation they’d double the value of their portfolio in approximately ten years. However, what if you chose to put the money under the mattress? With a 7% annual inflation rate, you’d lose half of your purchasing power in approximately ten years. Which is effectively the same as losing half of your money. Today inflation is more than 7% annually. We certainly hope inflation doesn’t run that hot for 10 years, nor do we expect it will. Although if we’re wrong and inflation does run that high for that long, those earning zero sitting in cash will suffer a 50% loss in a decade or less.
The important lesson here is that there really is no such thing as a riskless investment. The risk of being too conservative can be just as dangerous as the risk of being too aggressive. Ultimately the point of investing is to grow your assets to both keep up with and outpace inflation over the longer term. The best way to do this is always a well-diversified strategy that utilizes many asset classes rather than trying to time markets. History shows us repeatedly that market timing is an exercise in futility, and given enough time, all asset classes will rise. Having the discipline to allocate assets across many asset classes according to financial goals is the best way to mitigate the collective of all of these risks.
Filed under: Articles
Comments: Comments Off on Losing Money Safely: The Risks of Being Too Conservative
Reversion to the mean is a phrase often used in investing. It is the statistical phenomenon stating that the greater the deviation of a random variant from its mean, the greater the probability that the next measured variate will deviate less far from its mean. In other words, an extreme event is likely to be followed by a less extreme event. Sometimes in investing, these variations can be short term, and sometimes it can take years, or even decades.
Growth investing is about finding companies that are expected to grow their revenue or cash flows faster than the rest of the broader market, and hence their profits are expected to grow at a faster pace. As growth is the priority, these companies reinvest earnings in themselves in order to expand, in the form of new workers, equipment, and acquisitions.
Value investing is about finding opportunities in companies whose stock prices don’t necessarily reflect their fundamental worth. Value investors look for companies trading at a share price that’s considered a bargain. As time goes on, they expect the market will properly recognize the company’s value and the price will rise.
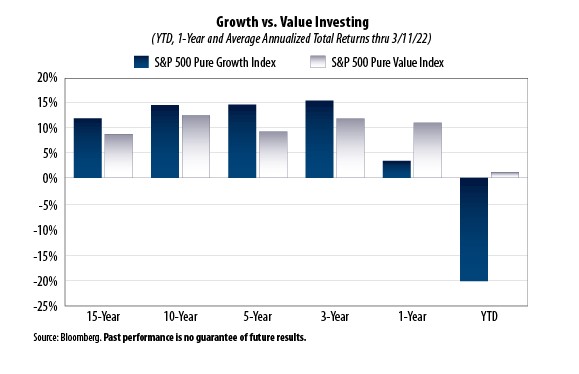
The debate of value versus growth investing is one that has gone on for years. There is no absolute definitive answer as to which is the better choice. We’ve seen some data that suggest that given enough time value will outperform, but only slightly. This was outlined in our September 2nd 2020 article, “Value vs Growth: Which is Better“. However, that can be over quite a long period of time. As we can see from the Bloomberg data in the chart above provided by First Trust Portfolios, value has lagged growth for the better part of 15 years until very recently.
The question today is whether this recent change is that inevitable reversion to the mean; or is the recent trend favoring growth stocks still in place? That is a question that is impossible to answer with any degree of certainty, as is any short-term investment forecast.
Investors often choose between value and growth based on their personal goals.
Investors that want less volatility and more income will often choose the value investing approach. Investors less concerned about volatility that are more willing to take on risk, and don’t need an income stream are more inclined to choose growth stocks for higher potential appreciation. A well-balanced portfolio will typically have a reasonable exposure to both. Choosing exclusively one over the other is a form of market timing that is quite difficult to predict.
While we don’t believe in or attempt to time markets, it is not unreasonable to presume that this trend may be changing. This is not just due to the inevitable reversion to the mean. It is also because there have been historically certain environments that have favored value stocks over growth stocks. One such example is that value stocks have tended to outperform growth stocks when the yield on the benchmark 10-year Treasury note rises. A declining 10-year Treasury note has favored growth stocks. Currently, the trend is that the yield on the 10-year Treasury note is rising. If this continues, this may favor value companies in the next several years.
The reason for this is that a company’s stock price is simply the value of future cash flows discounted by some interest rate. A series of cash flows from company revenue that extends way into the future (the numerator), divided by an interest rate (the denominator), is a basic formula for discounting future cash flows back to today to give us a stock price. The higher the denominator, the more it impacts the potential value of the stock. Growth stocks are companies that are anticipating higher future cash flow, as opposed to value companies that are already discounted.
One can never be sure about a particular trend in the market, just as we can’t be sure of the trend in interest rates which play a role in the outcome of how these two areas of the market behave. It was only in the year 2020 that growth stocks outperformed value stocks by the widest margin on record. According to Morningstar, the average large cap growth fund returned 34.8% in 2020, while the average large cap value fund returned only 2.8% the same year.
This data from as recent as just 2020 could have easily led an investor to abandon their value stocks or funds out of frustration, and yet here we are in the first quarter of 2022 with the exact opposite result.
In the end, the best approach is always a diversified portfolio that maintains a good mix of dividend paying value companies along with a growth side of the portfolio. Regardless of the asset class, given enough time, there will likely be a reversion to the mean.
Filed under: Articles
Comments: Comments Off on Value vs Growth Investing: Is the Trend Changing?
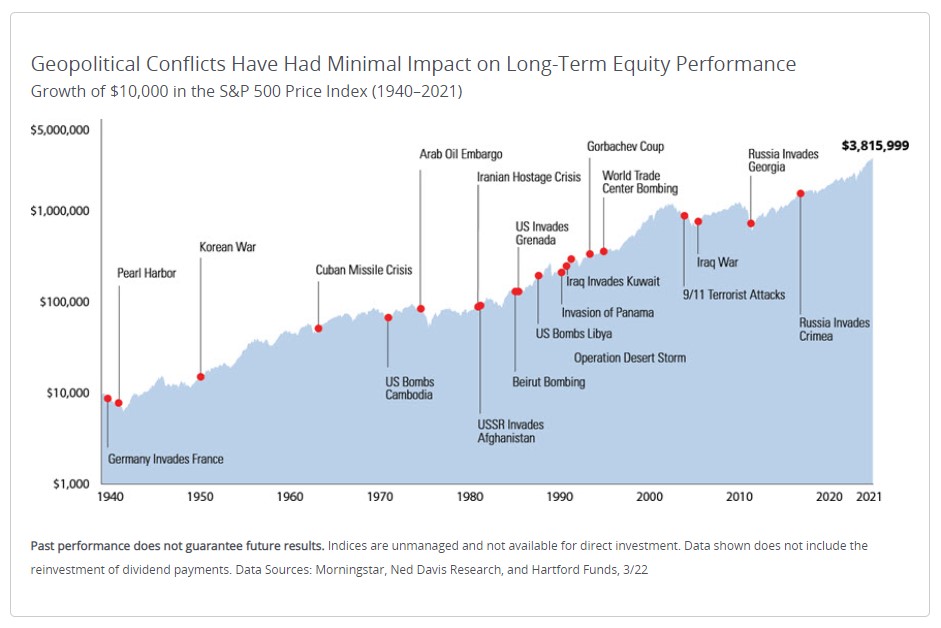
We often say that financial markets are the equivalent to a massive financial ecosystem in which no one event or action tells the entire story. However, there are often singular events that can have a more substantial impact on the behavior and price action across the markets. Sometimes these are positive events, and sometimes negative. We tend to remember the negative events more than the positives, as is our nature as human beings. This is particularly true when it comes to financial markets, since they tend to take the escalator on the upside, and the elevator on the downside. As it pertains specifically to geopolitical events such as a military conflict, like every other event, they have had no substantive impact on the long-term returns of financial markets.
Looking at the above slide provided by Hartford Financial, we can see numerous military conflicts which have occurred since from World War II through the present day. The data clearly demonstrates the nominal impact military conflicts have had on long-term results.
While it’s true that the longer-term impact has been essentially non-existent, that is not to say that the short-term impact is irrelevant. We often discuss the risk of volatility in a portfolio, and particularly how it may impact the results of an investor that is currently dependent on their investments to generate an income stream. A prolonged downturn can have an impact on such a scenario.
Let’s look at how well markets did in the immediate aftermath of some of these major events.
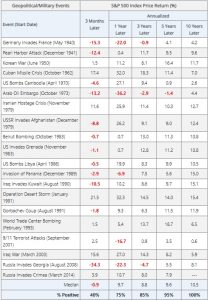
According to Morningstar and Ned Davis Research provided by Hartford, these are the annualized returns of the S&P 500 in the one, three, five and ten years following the below referenced events:
As we can see, in each of these examples, the three-year return was a positive annual return, with the exception of 3 periods. One of which was 2008, which had little to do with the invasion of Georgia, and quite a bit to do with the global financial crisis.
What is clear from the data is that even in a relatively short period of time, markets tend to rebound significantly after a military conflict. The above examples also assume a 100% exposure to the S&P 500 as your sole investment. In reality, it is highly probable that anyone dependent on their portfolio for an income stream would own various assets, including that of fixed income which tends to be far less volatile in times of economic and financial stress. As a result, the time it would take to recover from any portfolio losses is likely even further shortened. Additionally, this data reflects only the price return of the S&P 500 and does not reflect the dividend yield, which would have turned the 3-year return following 1940 and 1973 into a net positive period.
None of this is meant to minimize the human cost of any military conflict and how it impacts those that are forced to endure the horrors experienced in the theatre of combat. However, as an investor it is important to take into account the best way for you to proceed during periods of volatility regardless of the cause.
As long as markets exist, asset prices will rise over time. Unless the next military conflict is a nuclear holocaust that wipes out the majority of the world’s population, or the free-market system is completely abolished and replaced with some form a centrally planned global state, then markets are likely to continue to rise. Ultimately, as we often suggest, it is not wise to bet on the end of the world, since it only happens once.
Filed under: Articles
Comments: Comments Off on Military Conflicts: What is the Impact on the Market?
Will Social Security be there when I retire or will it run out, this is one of the more common concerns heard from clients in financial planning circles for years. The question is, should you legitimately be concerned? The answer is both YES and NO.
The concern about your Social Security payments ceasing because of the trust fund running out is likely an unrealistic concern. However, there are some legitimate serious concerns about the impact of social security and other entitlement programs, and how they might impact you.
Let’s start with why the payments won’t likely stop. The Social Security trust fund is made of what is called intragovernmental debt. The money that goes into the fund via payroll taxes from you and your employer’s contributions is invested in US government debt, which of course is an obligation of the taxpayers of the United States anyway. In 1968 beginning with the 1969 budget, Social Security became part of the Unified Budget Process. This meant that the receipts and outlays of the trust fund became part of the overall Federal budget. In the 1990’s Budget Enforcement Act these receipts and outlays were again segregated for accounting purposes.
In order to understand this better, one needs to really understand the basics of money creation. In reality, the Federal government has historically spent more than it collects in most years for all budget items, not just entitlements. In the eyes of most people, spending more than you collect is a significant problem. In terms of how a national government works, it can be a problem but doesn’t necessarily have to be.
The United States and every other nation now use what is called a fiat currency system, as well as something known as Fractional Reserve Banking (FRB). In simple terms, in a fiat system imagine if the Federal government in a given year spends $10 in the Federal budget, and simultaneously collects $7 in taxes. That means that $10 was pushed into the economy somewhere, and $7 was taken back out. Simple math tells us that there is now an additional $3 circulating in the economy somewhere. That additional $3 is part of the annual deficit. An additional $3 is issued in US treasury bonds in its place and added to the debt. What we can see from this process is that not only does the government simply create money out of thin air, but the deficit is necessary to help expand the supply of money. Since the government can in reality, not just in theory create an unlimited amount of money, the risk of running out of money is not really a risk. In fact, under the current system in place for more than a century, all money is created from debt. Furthermore, if you reversed the process and collected more in taxes than the government spent on a perpetual basis, also called a surplus, you would eventually run out of money. This is because you would be constantly pulling more money out of circulation than you are putting into circulation. So, running out of money is not technically possible, because the government can in fact create money at infinitum. The government would have to choose not to pay an obligation.
The monetary system is much more complex than this. The government has more than one way to create money. They can also create money via the Federal Reserve through what is called Open Market Operations. The Federal Reserve can also create money out of thin air, and then go and buy government bonds from institutions and individuals. The bonds they buy puts more cash into circulation, and the Federal Reserve then holds those bonds to maturity. Any profit they make on the purchase of these bonds is then returned to the US Treasury. This type of activity creates more money in circulation, but doesn’t directly service the US budget obligations. The direct spending authorized by the US Congress is what essentially pays the bills. Remember that in any given year, the budget numbers are determined the prior year in advance of the known tax revenue, and entitlements like Social Security are not even negotiated as part of the budget process, as they are mandatory non-discretionary spending.
Does this then mean that there is nothing to worry about? The answer is NO. There is plenty to worry about. Even though a government doesn’t “run out of money”, as we have seen throughout history, too much money creation can be a substantial problem. A little more than a decade ago we saw a sovereign debt crisis spread across Europe. Countries like Greece, which was among the most fiscally impaired, never went bankrupt and never ran out of money. However, a nations debt is dependent on the market for people, corporations and other nations to buy and trust that debt as investors. When the buyers of the debt grow concerned, they demand higher interest payments, and maybe stop buying altogether. Nations like Greece were forced by their European Union counterparts to impose austerity on their fiscal budgets to bring them back into something more reasonable. It’s essentially the equivalent of having to pay higher interest rates on your credit cards because you have a bad credit rating, which only further compounds your problems if you don’t correct your spending habits.
Furthermore, under the Fractional Reserve Lending (FRB) system, which is the banking process globally, things get more complicated. What is defined as money isn’t always entirely clear. The Federal government legally is the only entity that can officially create money. When the government spends and creates money, this gets added to what is called the Monetary Base. The Monetary Base is a measure of the cash circulating in people’s pockets, plus the cash reserves held by banks. However, banks can lend out at a ratio of about 10:1 for each dollar they have in reserves. When you go to the bank to get a car loan, they don’t take their reserves held in someone else’s savings account and lend it to you. They effectively also create money out of thin air via extending credit. The bank will create a digital dollar and loan it to you, which you then spend somewhere else, and someone else will deposit elsewhere. The loan creates the deposit, rather than the other way around. That loan becomes an asset to the bank, while your bank deposits are actually a liability to them. This credit expansion is part of what is called the M2 money supply, which is a broad definition of how much money is in circulation. Banks can lend out about $100 dollars for every $10 dollars in reserves.
Each time you borrow money, you expand the M2 money supply. Each time you make a debt payment, the loan is reduced or extinguished, and you shrink the M2 money supply. If there are more people wishing to borrow money than the banks reserves currently allow for, they can borrow from another bank’s reserves. If the banking system as a whole doesn’t have enough in reserves to meet the demand, they simply go to the Federal Reserve and borrow more money, which the Federal government creates for them. They can then lend out another $10 for every $1 the government lent them. Technically, the government can choose not to lend the bank this money and constrain banking reserves to restrict the money supply. However, in reality this doesn’t happen. If there is consumer demand, the Federal Reserve will meet that demand. This means a big part of money creation is based upon simply how much the public wishes to borrow. This is something in economics known as “Endogenous Money”.
So why is this something to be concerned with? The answer is too much money creation in excess of goods and services being produced means inflation, which is something we are seeing at the moment and addressed in our prior article on December 14th, (Inflation Today: What is it Really?). The gov’t has the ability to quickly change policy on things like expanding banking reserves through lending or bond buying. However, Federal spending on entitlements is mandatory. It is also an ever-growing portion of the Federal budget.
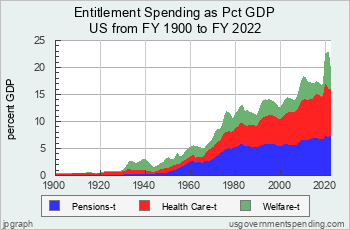
As you can see from the chart above from www.usgovernmentspending.com, entitlement spending as a share of GDP has grown enormously from 0.4% of GDP at the beginning of the 20th century, to 22.8% of GDP today. It also represents more than 50% of the current Federal budget, versus only 15% of Federal spending at the end of World War II.
More concerning is the unfunded future liabilities, which according to the US Treasury are now more than 161 trillion dollars in future promised benefits. That means we have promised benefits that are approximately 7 times the size of the current US economy, and about 7.5 times the amount of the total M2 money supply. This growth in spending means the total debt to GDP ratio has grown from 55% to over 125% today since the year 2000. There is a good degree of research that suggests that once an economy passes around a 90% debt to GDP ratio, slower economic growth is likely, as the cost to service the debt smothers future productivity. Essentially, the government begins to spend more money on things like entitlements, and less money is directed towards new innovations or more productive use. We are already well past that 90% ratio.
This doesn’t mean that this won’t go on for some time. Japan as an example has grown it’s debt to GDP ratio from 75% in 1992 to over 260% today. While that, plus some major demographic challenges has led to extended periods of incredibly slow growth, they also did not “run out of money”.
This is also not a problem which we can tax our way out of, as tax revenue is fairly consistent. As per the Tax Policy Center, total tax revenue is consistently between 15-20% of GDP since the end of World War II. During periods of expansion, the treasury tends to collect more in revenue, and during periods of recession it collects closer to the lower end of this range. This was true when the top marginal rate was over 90%, and as low as 28%. As an example, here is a comparison of 1946 versus 1988:
1946
The top marginal rate for an individual was 91%, and for a corporation 38%.
The total revenue to the US Treasury from all sources was 17.2% of GDP. Approximately 7.1% of GDP came from individuals, and 5.2% of GDP came from corporate income tax. Payroll taxes accounted for 1.4% of GDP. The rest came from various other sources to the treasury.
1988
The top marginal rate for an individual was 28%, and for a corporation 34%.
The total revenue to the US Treasury from all sources was 17.7% of GDP. Approximately 7.8% of GDP came from individuals, 1.8% of GDP came from corporate income tax. Payroll taxes accounted for 6.5% of GDP. The rest came from various other sources to the treasury.
If you look closely, you can see that the total revenue to the Treasury was actually higher in 1988, although within the normal range of tax revenue as a share of GDP. It’s also worth noting that corporate income taxes contributed a much smaller percentage to GDP. However if we compare these two periods, we can see that payroll tax revenue, which funds social entitlement programs rose by 5.1% of GDP. Since employers must pay 50% of the payroll tax liability, their combined contribution was still about 4.4% of GDP. Additionally, since the creation of S-Corps and LLC’s as “pass thru” entities for small business owners with less than 100 employees, more business are filing their taxes as personal income rather than corporate income. What you can see is that employers are paying effectively similar percentages in taxes, they are just paying it under a different column in the tax revenue ledger. Tax revenue has not changed substantially, but spending has risen dramatically. In fact, some of the highest tax nations in the developed world face even greater fiscal challenges from their entitlement programs.
Ultimately, entitlement benefits must be cut at some point in time. Whether that is because the US government reaches a point not unlike Europe’s sovereign debt problem in which the rest of the world via the debt markets forces us into austerity, or because our elected officials finally come to the conclusion that this is an unsustainable path is hard to predict. The latter seems unlikely at the current moment. In the political world, once the toothpaste is out of the tube, it’s very hard to put it back in. Nobody seems to want to run for office promising to take away one of your benefits. Even if they did, they are not likely to get much cooperation from their counterparts in Washington D.C. at this point.
What will these cuts look like, and when does this happen? Well, nobody knows for sure. However, we think Social Security is the easiest to address of all the entitlement programs where some relatively minor changes could make a big difference. Simply raising the age of full benefits is one possibility, as well as even raising the age of early benefits. When social security was first created the average life expectancy was substantially lower, and they never expected to pay people as long as they are now. The system was not actuarily designed for people to live as long we do today, and should be corrected to reflect longer life expectancies.
Another possibility, although less popular is means testing benefits. However, future taxpayers may not like the idea of paying into a system for decades that is designed to supplement their retirement, and then getting nothing in return if they exceed a certain asset or income level set by Congress. Yet, that does remain a future possibility. There are other possible solutions, and it may be a combination of things.
However, it still remains highly unlikely that Social Security will just stop for anyone currently collecting or close to collecting benefits. It is not unlikely that younger generations at some point will see a benefit system that doesn’t pay out at the same rate the current system pays.
The timing of when these issues will get addressed is nearly impossible to predict, and will depend on a confluence of events that nobody can accurately time. In order to truly understand why your benefits won’t likely just cease, its important to understand that a national budget is very different than that of a household budget, and governments don’t just run out of money the way you or I can. Still, history tells us that while govt’s can create unlimited amounts of money, it is not without potentially serious consequences. Unfortunately, it often seems that the very reason that the government can’t run out of money is precisely what drives so much rapidly increasing and often reckless spending. Perhaps the Federal government could learn a thing or two from the average citizen about proper budgeting.
Filed under: Articles
Comments: Comments Off on Social Security: Will the Gov’t Run Out of Money?
In February of 2015, we wrote an article about the topic of inflation that tried to address not only some of the concerns about inflation, but also some of the confusing and seemingly misleading inflation data. Particularly, how the measures of inflation have changed over the years to reflect what may be a very inaccurate picture for a large number of Americans.
Let’s start with a little history. Inflation measures were traditionally designed to measure a constant standard of living. This was done by observing a fixed basket of goods and measuring the price changes without materially altering their weighting. In fact, prior to 1945, what we now call the Consumer Price Index (CPI) was actually known as the Cost of Living Index.
However, this concept evolved in academia to measure a constant level of satisfaction. The idea was that the changing relative costs of goods would lead consumers to substitute less-expensive goods in place of more-expensive goods. If such a substitution of goods was allowed for within what was once a model of a fixed-basket of goods, the maximization of the “utility” of money held by consumers would allow for the attainment of “constant level of satisfaction” for the consumer. These types of geometric weightings are now the method of choice.
In more simple terms, if consumers were once eating steak three nights a week, but the cost of steak has grown, and they are now relegated to buying a less expensive set of goods such as pasta, then pasta would increase in the weighting of the CPI since it is more actively consumed. This is essentially how CPI is calculated today. The more something is consumed, the bigger weighting it will eventually have. This was seemingly viewed as a positive change in academia as the presumption is that the level of satisfaction is the same because a less expensive product is being used to meet the same need and expanding the “utility” of money.
The utility of money is defined as “the satisfaction of or benefit derived by consuming a product”. These types of interpretations may seem quite nebulous to the layperson. In the example above, there may be some people who are just as satisfied by eating less expensive pasta rather than spending their money on steak, while others may not be so pleased by this outcome, and don’t particularly like pasta. It is for that reason that we would argue that some of the inflation data is misleading versus the real-world experience.
Recently the Bureau of Labor and Statistics announced that beginning in January 2022 it will be changing the weightings in the Consumer Price Index to reflect the 2019/2020 consumption expenditure data.
Many changes have been made to the methods of calculating inflation over the decades. Economist and economic consultant Walter J. Williams has written about this for years. Using his inflation models, he contends that if we were to use the same formula that was used in 1990, the rate of inflation is in excess of 10% as of November 2021. He also has models using the 1980 based methodology which places current inflation closer to 15%. Perhaps, the new models are more accurate. That would then by process of elimination mean that the higher inflation seen in the late 1970’s to the early 1980’s was not as bad as we thought. However, we think those who lived through that period would likely disagree.
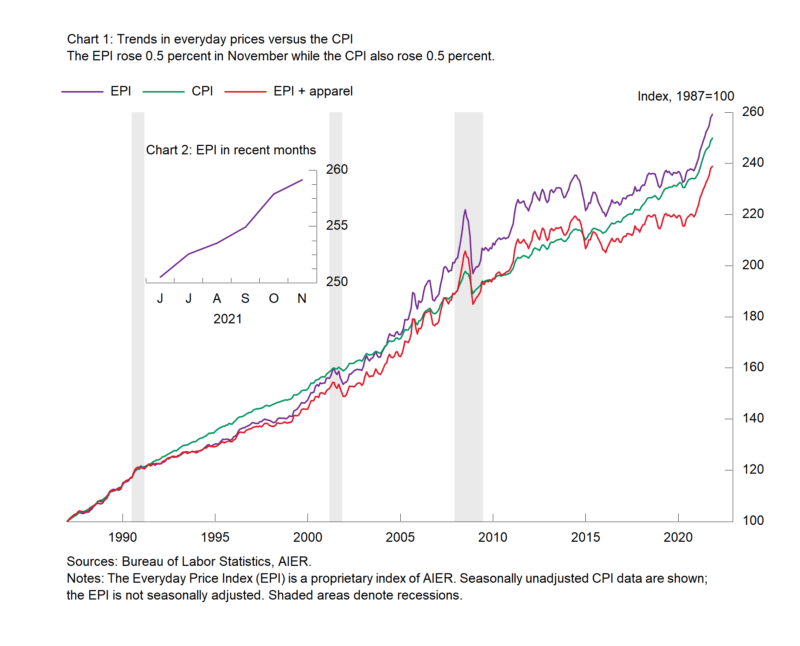
The American Institute for Economic Research maintains an inflation calculation created by two economists, Polina Vlasenko and Steven R. Cunningham, called the Everyday Price Index (EPI) which is designed to look closer at the consumers reality. The premise is that they essentially place heavier weightings on the items that are purchased more frequently, such as grocery shopping, and less of a weighting on items that are bought less frequently, such as a new television. As seen in the above chart, through November of 2021 the EPI was at 9.3% versus the governments CPI data of 6.8%.
Another change that has resulted in a significant difference in the way inflation was calculated in the 1980’s data versus today, is housing. House price inflation was included as a metric then, while today it is not. As Joseph Carson, the former Chief Economist for Alliance Bernstein recently noted this past July 2021:
“Here’s a simple illustration of how significant including and not including house price inflation can be. In 1979, CPI rose 11.3%, and that included a 14% increase in the price of existing homes. In the past twelve months, CPI has increased 5.4%, and the 23% increase in existing home prices is not part of that. Government statisticians have created an arbitrary owner rent index (up 2.3% in the past year) to replace house prices.”
The case for not including housing was that it is a long-lived asset that the consumer will consume for a series of years or perhaps decades. Yet, while home prices are excluded, short lived items like food and energy are also excluded from the Core CPI. Meanwhile used car and truck prices, which can have a ten-year life span have a 3% weight to the CPI. If you are a potential new home buyer, this may seem somewhat disconnected from reality.
Another variable in the CPI data is that there is more than one version of the CPI. CPI-U measures the rates of inflation for urban areas, and CPI-W measures the inflation rate for clerical workers. These two are used to determine the annual increase in Social Security payments. One of the most commonly quoted measures of inflation is called the “Core CPI” which excludes the impact of food and energy products, which explains a good degree of the discrepancy between the CPI and Everyday Price Index (EPI). The premise for excluding them is that food and energy are extremely volatile and don’t represent the true picture of aggregate economic demand. Unfortunately, people still need to eat, heat their homes in the winter and fill up their gas tanks. As a result, it’s not too difficult to see why many people still believe that inflation data, which has been on the rise still doesn’t represent their real-life experience.
Hedonic adjustments are another aspect of how inflation data can be misleading. Hedonic adjustments attempt to measure the quality changes in a product or service. Imagine if a new computer increases in price by 5%, and the computer was exactly the same, that would mean it reflects inflation of 5%. However, if the quality of the computer has changed, and you are paying 5% more in price for a computer that has 10% more capability, then a hedonic adjustment may assume that the computer is selling for 5% less because you are getting more for your money, even though you spent 5% more in price. While in some cases this can make sense, what if the new added capability is of zero use to you, but that is all that is available in the marketplace? Have you really seen a reduction in price? Not necessarily. However, in the eyes if the Bureau of Labor and Statistics (BLS), that can be a reduction in cost via a hedonic adjustment. We see positive and negative adjustments all around us. The question is whether the BLS captures all of the boxes of cereal that sell for the same price, but now have a smaller box? This seems unlikely. It sometimes seems as though they capture the positively impactful adjustments whether they are relevant or not, and miss some of the negatively impactful adjustments.
At this point in time there are several drivers of inflation. Supply chain disruptions still resulting from the government shutdown, an unprecedented expansion of the M2 money supply, and higher energy prices. While supply chain problems will likely resolve over the next year, the other two issues may be with us awhile. The money supply has grown by 33% in one year versus a normal 6% annual increase. Energy prices have increased substantially, which translates into cost push inflation, and any significant capacity expansion in US energy seems unlikely in the next few years.
We have never been convinced that this particular period of higher inflation is as temporary or “transitory” as the Federal Reserve initially implied. It is beginning to seem that they are finally arriving at that conclusion as well. Or, they always believed this to be the case and did not wish to make it a public statement.
We would contend that each individual should essentially have their own personal inflation model based on their own behaviors. However, that is not terribly practical for the Bureau of Labor and Statistics. As a result, we believe this places a greater importance on financial planning, particularly for those closing in on retirement who will not have increasing wages to go along with increasing prices. Having a greater understanding of where your spending is headed based on your lifestyle goals is a key part of a well-designed financial plan. As inflation continues to climb, this is something at Landmark we try to address for all clients with a look towards their longer-term plans.
Filed under: Articles
Comments: Comments Off on Inflation Today: What is it Really?
Opportunity cost is defined as the potential benefit an investor misses out on when choosing one alternative over another. Every investor can likely think of an example of something that they once owned and sold at the wrong time or planned to buy and chose not to do so. Some of those examples can be quite frustrating in hindsight. However, in some cases, even what seems like the wrong decision may have still been the correct decision.
It’s never a good idea to make investment decisions based on where you were, rather than making decisions based on where you are. In financial planning investors are routinely faced with these decisions, even if you are not an active trader. Such examples can be something as simple as choosing to buy a car in cash versus financing a car purchase. Or, possibly whether or not you should pay off your mortgage or not.
Imagine a situation in which you had an investment portfolio of $200k that was averaging 7% annually. Simultaneously, you have a large cash position in the bank of $100k earning just 0.50%, with a mortgage balance on your home of $100k in which you are paying 3.5% interest. Simple math would tell us that you are better off investing that money at a 7% average return than keeping it in the bank or paying off the loan. However, depending on your personal situation, there may be more than one correct answer.
As an example, imagine you are closing in on retirement or already retired and by nature are very conservative. A portfolio that is averaging 7% annually is not necessarily going to guarantee such a return every year. It is a reasonable long-term assumption, but in the short term can be negative for several years. Committing capital to a portfolio may not be worth the volatility to you, particularly if the lack of a cash position will drive you to panic in the face of market volatility and sell your investments at an inopportune time.
So perhaps you should pay off the mortgage and save the extra 3%, which is the difference between the interest rate on the loan and the savings account rate. Well, this doesn’t always make sense either. Every investor should have an emergency fund of 6 months to 1 year of cash to fund their lifestyle. Without such liquidity, if you pay off your loan you won’t have the liquidity to address an emergency, and you may have to resort to selling assets such as your brokerage account that was averaging 7%. The unwritten rule of “Murphy’s Law” tells us that emergencies tend to come at inopportune times, and you may be selling investments at a low point in financial markets. Another possible issue is you may be forced to pay capital gains tax at an inopportune time.
Additionally, depending on how far into the mortgage you are, it may not make sense to pay it off. If you are 25 years into a 30-year loan, even though your interest rate is 3.5%, most of that interest was paid in the beginning, and you are now paying primarily principal. Paying off the loan at that point may not amount to much of a savings at all. Sometimes keeping cash on hand is the correct decision.
Even if your portfolio continues to earn very good returns, it doesn’t mean the correct decision is to commit all of your capital there. Investors have no control over, nor can they accurately predict short-term volatility with any degree of certainty on a consistent basis. Neither can the best of investment professionals. While the “would have, could have, should have” feeling may rest in the pit of your stomach, you may still have made the correct prudent decision.
Similar examples can made in terms of portfolio allocation. While a well-diversified portfolio is the prudent decision to fund your future as well as current retirement goals, we can all think of that example of a stock that you believed in, or just had a feeling about that could have made you an extraordinary amount of money. However, investors tend to remember the opportunity cost they missed that would have worked out well. That is where your regret comes from. We tend to forget the ideas we had and didn’t act on that would have ended catastrophically. Sometimes it’s the moves you didn’t make that are the best decisions you’ve made.
Financial planning is about having a strategic approach to achieving a set of goals that will take you from point A to point B with the least amount of risk that is necessary. This means that in the end, the correct decision isn’t always the one that yields the best outcome. The correct decision is the one with the most likely outcome of accomplishing your goals.
Filed under: Articles
Comments: Comments Off on Opportunity Cost: What it Means to You