Over the last decade much has been made of the cryptocurrency space, more specifically Bitcoin. While some have embraced it, others still shun it as either an asset or a currency. To date, it is not something we are comfortable investing in. However, we remain open to the possibility as Bitcoin and other such cryptocurrencies evolve.
The blockchain technology that Bitcoin was built on has many possible benefits across various industries. However, beyond the technology that it sits on, the first challenge with Bitcoin is that calling it an asset is questionable. Clearly it is not a tangible asset. That cannot be questioned. However, can it be called an intangible asset?
The Financial Accounting Standards Board defines an intangible asset as: “An asset, other than a financial asset, that lacks physical substance”.
The International Accounting Standards Board defines an intangible asset as: “An identifiable non-monetary asset without physical substance.”
The first question would be, is Bitcoin a monetary asset?
It certainly seems to be used as one in recent years by a large number of people. One of the arguments in favor of Bitcoin is that as a monetary alternative it has a theoretical finite supply, whereas dollars, or any other monetary system established is now infinite thanks to central banks globally. It’s easy to see why some may find this attractive.
Let’s first look at the US Dollar.
When the United States left the gold standard in August of 1971 an ounce of gold was $35.00.
According to the US Census Bureau the average cost to buy a gallon of Milk in 1971 was about $0.356. In other words, in 1971 it would have cost you approximately 0.01 ounces of gold to buy a gallon of milk.
If we fast forward to 2024, gold is approximately $2,140 an ounce. According to the St. Louis Federal Reserve, as of February 2024, the average price of a gallon of milk in the United States is about $3.94.
That means that it would now cost you only 0.001 ounces of gold to buy that same gallon of milk. Milk is now 11 times more expensive since 1971. Yet, in terms of real purchasing power, you need only 1/10th the amount of gold to buy the exact same item.
What this shows is that gold has mostly kept up with the price changes. Obviously, this would vary somewhat depending on which purchased item we were examining, as some products have grown in price faster than others.
But what about income?
According to the US CensusBureau, the median income in 1971 was $10,290. In 2024, the median income is estimated at about $75,000 based on the most recent census data.
In other words, you would need a median national income of $102,900 (ten times the wages of 1971) for wages to have kept up with the price of gold to buy that same gallon of milk. Alternatively, you would need a $113,190 median income to see a zero loss of purchasing power in US dollars.
What this tells us is that while the average American is making substantially more than they were making in 1971, the U.S. dollar has lost a substantial amount of its purchasing power, and the increase in wages are nowhere near enough to keep up. More plainly stated, the median income has lost more than 33% of its real purchasing power since the US left the gold standard in 1971.
Considering that one of the two primary mandates of the Federal Reserve is that of price stability, it seems fair to say that they have failed terribly.
With this data, it’s easy to see why one would look for an alternative to the US dollar. After all, there is a long global history of fiat currencies self-destructing due to the hubris of policy makers.
The benefit of the gold standard is that it offered the ability to convert your dollars to physical gold. Gold on its own has intrinsic value. It has various applications, from jewelry, to electronics, to aerospace, and even some medical applications, making it a true asset. The past convertibility of currency to gold served as a potential check on policy makers from runaway spending, as they would fear a run on their currency. This limiting factor added greater price stability.
What about Bitcoin?
Does the limiting factor of a finite number of coins serve as a check on inflation? In theory the limiting aspect is a positive. However, the question of intrinsic value still persists. As an example, what if large numbers of people choose to adopt a different cryptocurrency for use in the exchange of goods and services. Perhaps one is developed that is more technologically efficient and easier to use. Then what is the intrinsic value of Bitcoin as it becomes a secondary or even peripheral option?
Bitcoin has no earnings, it has no cashflow, and it is backed by no tangible assets. While the US dollar is also no longer backed by any tangible assets for which you can convert to, it is still backed by the taxing power over the US economy. That alone is not enough stability, as there is clearly nothing that stops the political class from printing more money than the US government takes in from tax revenue. In fact, currently the US is setting records for the highest tax revenue in history, and still manages to create another trillion in deficits every 100 days.
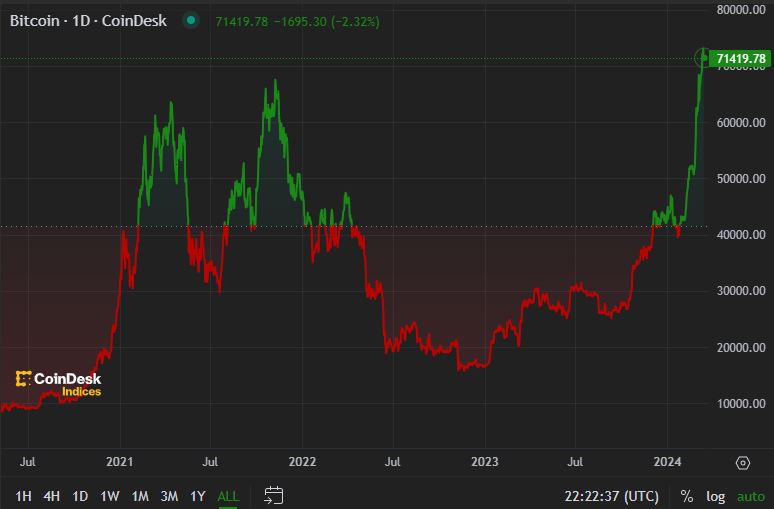
Ultimately, a currency should serve as a store of value. Just the price movement alone on Bitcoin alone should demonstrate it is not a store of value. Recent history saw Bitcoin fall from more than $67,000 per coin in November of 2021, to $16,000 per coin in November of 2022, before climbing back to more than $70,000 per coin recently.
To put that into perspective, that’s a -77% drop in one year. Imagine if you had $1,000 in the bank and one year later it had dropped to $230, yet you had taken no withdrawals. It’s probably fair to say most people would be quite upset. While the same can happen in the stock market, we don’t treat the stock market as a store of value. It is not a currency, but rather a long-term investment designed to grow.
Based on this information, it is fair to say that Bitcoin is not really a currency. At least it does not behave like one would hope and expect.
If Bitcoin is not a currency, but some other form of a non-monetary asset, then where does it derive its value. When thinking about the stock market, what makes a stock go up in value? In the short term a stock may go up or down for all kinds of speculative reasons. However, in the long term the only thing that matters is earnings. When we buy a stock, we are buying a business in the hopes that its profits will grow.
But Bitcoin has no earnings. It has no cash flow. It sells no product. One can argue it provides a service, as many businesses do. But when a business provides a service, its goal is to grow its customer base that utilizes this service to grow its market share so the business will grow its earnings. If the number of people that utilize Bitcoin were to increase tenfold, how much would its earnings grow by? The answer is zero, because it has no earnings.
Based on all available data, it seems that Bitcoin is built on nothing more than a lack of trust in monetary policy. While we share that same lack of trust, we don’t think Bitcoin is the answer. Perhaps a return to the gold standard or some other form of a monetary standard is the answer. In fact, many nations around the world have already begun such a coalition to return to the gold standard in an attempt to limit their exposure to the US dollar. While that is more of a geopolitical discussion for another time, the question of whether Bitcoin is the solution, or a viable investment is the issue at hand.
In many ways, Bitcoin seems to resemble the “Tulip Mania” period of the Dutch golden age of the 17th century than it does a real currency.
At this point, it seems nothing has changed that would alter our views on avoiding Bitcoin or any other cryptocurrency. Perhaps one day Bitcoin, or some other Crypto will be built with the direct backing of some form of a monetary standard, such as gold, silver or a basket of commodities that can be audited for authenticity, converted on demand, and enforced. Until that time, we remain skeptical.
Filed under: Articles
Comments: Comments Off on Bitcoin: Currency or Asset?
Market volatility is not something that investors enjoy, as none of us like to see our assets decline, even if it is for just a brief period of time. However, volatility is inevitable and must be dealt with to be a successful investor.
When investing for the future, most investors use some form of retirement plan for tax advantages, while others save independently in after tax accounts. However, while we save for the future, most often we are consistently peeling off a percentage of our earnings to allocate towards future goals. Since most Americans are paid either weekly or bi-weekly, we slowly allocate a percentage of this in what is known as dollar cost averaging.
Dollar cost averaging is a strategy whereby an investor contributes a set dollar amount or percentage over a time frame to their investments. Most of the time, dollar cost averaging happens because you are simply not in a position to invest all of the money at one time, as your employer is not going to pay you your compensation for the next 30 years in advance. However, in some cases investors do come into a large lump sum of money for various reasons, and they have a choice to make. Should they invest all of the cash at one time, or dollar cost average over a period of time. After all, committing a large amount of money at once just to see it immediately decline, in some cases substantially, can be rather distressing.
Fortunately, there is some data on which works better. Vanguard completed a study on this very topic which revealed that 2/3rds of the time the lump sum investment outperforms, while 1/3rd of the time dollar cost averaging yielded better results. The same study demonstrated that the longer the period of dollar cost averaging, the more it favored the lump sum. The reason for this is because historically markets are positive roughly 75% of the time, so the longer you wait, the more likely you are to be paying more for the same investments in the future.
Nevertheless, in the case of the typical 401k investor that is consistently deferring money from their paycheck for their future retirement, dollar cost averaging is the only choice. Yet, during periods of volatility, you may benefit from the market chaos.
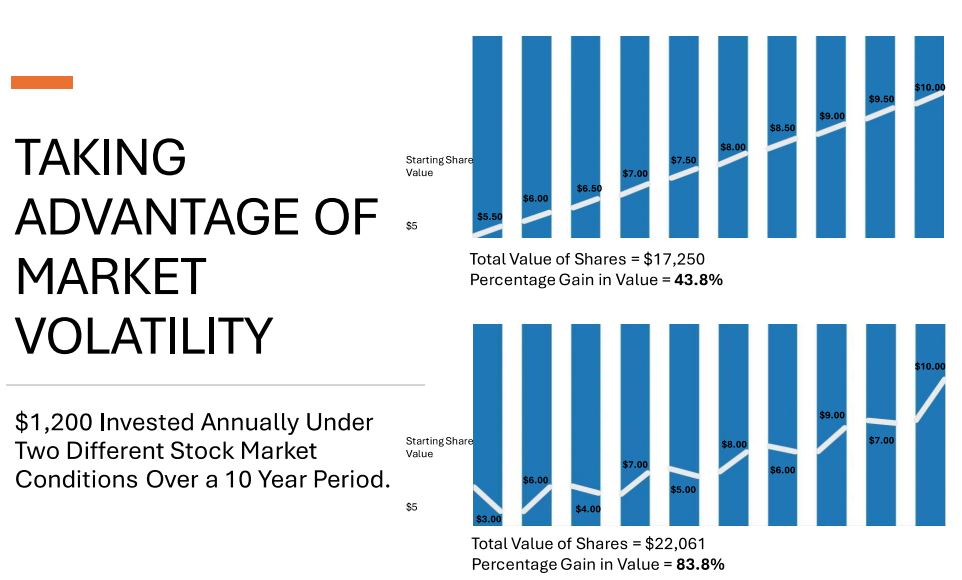
As illustrated in the image above, when we look at two contrasting scenarios in which each investor invests $1,200 annually starting at $5 per share and finishing at $10 per share over a 10-year period, we see different results.
The first investor saw a steady increase annually in their investment, and likely realized much less stress as their investment consistently increased with no volatility whatsoever, yet the paid more for each subsequent investment.
While the second investor saw choppier markets with periodic volatility causing annual investments to take place in both positive and negative years. This helped to bring their average cost down.
The results demonstrate the following:
Investor 1-Initial Investment – $12,000
$17,250 final market value and a cumulative return of 43.80%.
Investor 2-Initial Investment – $12,000
$22,061 final market value and a cumulative return of 83.80%.
It’s important to keep in mind that the first scenario of markets consistently rising with no downturns is almost certain not to happen. While volatility can be mild or extreme at different points in time, a good investor will stay the course. What this demonstrates is that while markets decline and volatility is not enjoyable in the moment that they happen, if you are disciplined and consistent investor, you can use this to your advantage.
Filed under: Articles
Comments: Comments Off on Market Volatility: Friend or Foe?
The importance of diversification has been well established across the investment research literature over many decades. It is a relatively easy principle for most investors to accept. The words “don’t keep all of your eggs in one basket” is one of the most common phrases repeated over time.
However, asset allocation is just as important. The concept of asset allocation is based on the notion that not only do you not want to own just a few companies, but you also want to own assets that demonstrate a lower correlation to each other. A lower correlation simply means that multiple assets may increase over time, but at different times, for different reasons, in different environments.
As an example, the use of owning stocks across various market capitalizations, (Large, Mid & Small Cap stocks), and different regions of the world help diversify a portfolio. Additionally, the use of other assets such as fixed income, real estate, and commodities further lower correlations in an investment portfolio.
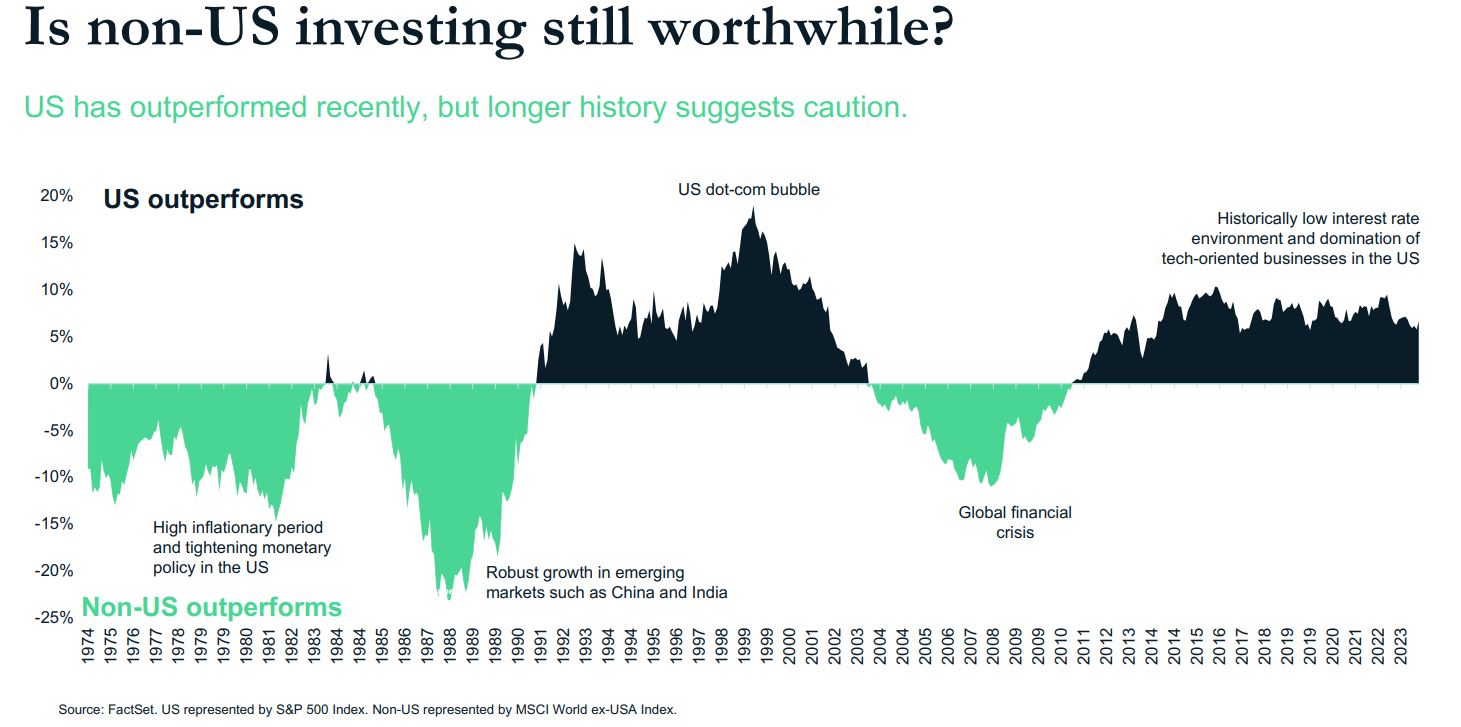
The use of international investments is one of the areas that has recently come under scrutiny as the US stock market, particularly the S&P 500 index has significantly outperformed international stocks for the better part of the last 15 years. However, as the chart above courtesy of Diamond Hill Investments shows, it is not necessarily unusual for US or foreign equities to lead for significant periods of time.
During the seven years from 2004-2011, international stocks had a more favorable performance. During the seventeen years between 1974-1991 international stocks also outperformed. This is often overlooked because during periods like the 1980’s US stocks did exceptionally well. Yet, for most of that period, international stocks did even better.
When looking at recent history, not only do we see that the US has had an extended period of recent outperformance but is also trading at relatively high prices by comparison. As an example, as of January 31st, 2024, the MSCI USA Index was trading at a price to earnings ratio (PE ratio) of 25.4. While the MSCI ACWI ex USA index (which is a foreign stock index) was trading at a PE ratio of 14.9, making it comparatively cheap.
This data suggests that foreign stocks are substantially undervalued and more attractive when compared to the US stock market. Does this mean that foreign stocks will outperform in the near future? Not necessarily, or at least not right away. However, it does make a strong case for owning foreign stocks. History suggests there will be a reversion to the mean, and at some point, foreign stocks will lead the markets again. Timing such a reversal is just as futile as timing markets in general. The more important lesson is that foreign stocks play a role in a portfolio over time.
As a result, we believe there should always be some degree of exposure in foreign stocks as part of an overall asset allocation to aid in the diversification of a sound long-term investment strategy.
Filed under: Articles
Comments: Comments Off on Foreign Stocks: Do They Still Make Sense?
Recently we’ve seen signs of softening in the housing market due to the increase in interest rates to combat inflation. The concerns around a future recession often bring about concerns of declining asset prices, from stocks to bonds and real estate.
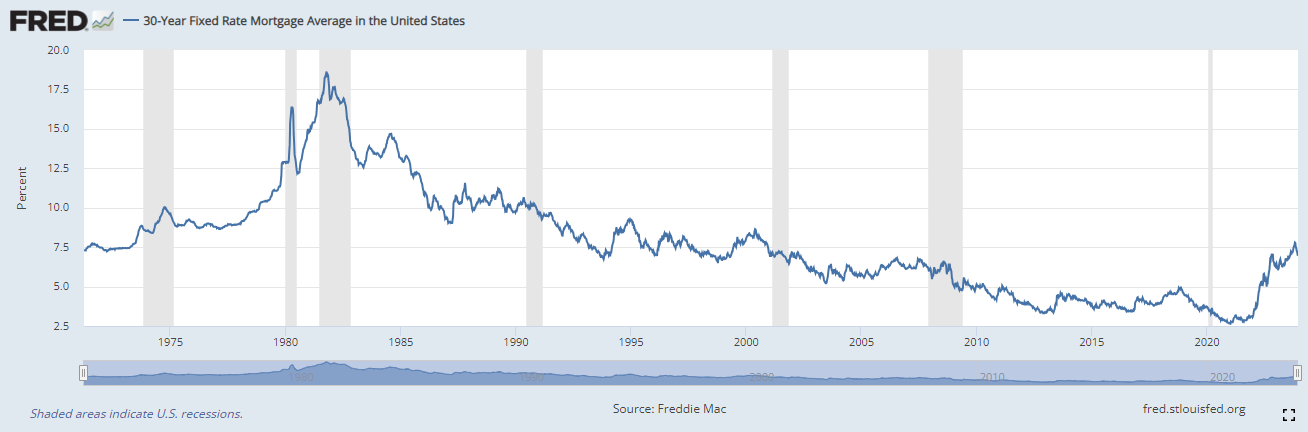
In the case of home prices, historically one of the biggest drivers of real estate values has always been the cost of financing. The higher the cost to borrow, the less the borrower can qualify for in lending. When looking at current financing costs, the average 30-year loan as of December 14th, 2024, is being issued at 6.95% according to the St. Louis Federal Reserve. To many younger readers, this may seem like an extremely high cost of borrowing. However, looking at the historical chart above, we can see that since the end of World War 2, the cost of borrowing has historically been above 7%, and in some cases much higher, peaking in September of 1981 at a whopping 18.27% average rate.
In fact, it is a relatively recent phenomenon that mortgage rates have been as low as they have been, which began with very aggressive Federal Reserve policy following the year 2000 technology crash, and then later amplified by the financial crisis. This was very recently followed by 2022 and 2023, which was one of the most aggressive series of actions by the Federal Reserve, increasing short-term lending numerous times from 0%, to 5.50%. While rates in the early 1980’s were much higher, the speed at which rates increased this time was much quicker.
Ultimately, does this mean doom for the housing market? Not necessarily. While it’s reasonable to assume this will impact the residential housing market negatively, there are other variables to consider.
After two decades of declining rates, a July 2023 report by Redfin found that currently in the United States:
91.8% of homeowners have locked in a mortgage rate below 6%.
82.4% of homeowners have locked in a mortgage rate below 5%.
62% of homeowners have locked in a mortgage rate below 4%.
23.5% of homeowners have locked in a mortgage rate below 3%.
When taking this into consideration, you can see why a substantial number of Americans would be hesitant to sell their homes if they are locked into such a low rate. Never forget that prices are set by the intersection of supply and demand. If a large number of people remain hesitant to sell due to their rate locks, that means the supply that would otherwise have hit the market is being suppressed.
As a homeowner, this helps anchor some stability in the equity of your home. However, as a younger couple, this may limit your ability to afford a home, as prices have not declined in accordance with the pace of interest rate increases, as normally would have been the case.
Does this mean that home values are invulnerable in the current environment? Certainly not. There are many variables that impact prices.
Should inflation re-accelerate, the Federal Reserve could be forced to further raise rates well above current expectations. If so, there would eventually be a point at which lending rates overwhelmed current prices.
If there were a severe enough recession, there could be a large enough spike in unemployment that leads to a substantial increase in loan defaults, thereby forcing more supply into the market.
While it’s impossible to predict short-term prices, it seems that the housing market may maintain some short-term support.
Commercial real estate seems to be somewhat more of a potential concern. Aside from the impact of higher interest rates, we still see some very high vacancy rates in the commercial real estate market, particularly in major cities with office space. The post covid world has seen much more of the workforce revert to working from home permanently.
In 2023 we have already seen some very high-profile defaults. PIMCO’s Columbia Property Trust defaulted on $1.7 billion of debt backed by a portfolio of US office space. Brookfield incurred a $750 million default on two large office towers in Los Angeles. RXR properties defaulted on a $240 million loan on a 33-story office tower in Manhattan. Additionally, other high-profile developers have liquidated properties at deep discounts in recent months.
Whether or not the concerns around commercial real estate begin to spread into other areas of the overall economy remain to be seen. However, like any other asset, expansion and contraction in prices are cyclical.
When making a real estate investment, it’s wise to still take a longer-term approach. In 2009, there was not a single prediction we can think of that would have suggested the Federal Reserve would hold rates at near zero for more than a decade. At the start of 2020, you would be hard pressed to find anyone that would have predicted the Federal Reserve would have set the Fed funds rate at 5.50%. As a result, we would suggest that any financial commitment to a property be a longer-term commitment, as trying to predict short-term real estate values or Federal Reserve policy with any degree of precision is as unrealistic as timing the stock market.
Filed under: Articles
Comments: Comments Off on Interest Rates and Real Estate: What Can You Expect?
One of the confusing aspects of reading a monthly statement or your positions page on the website from your brokerage firm is the gain and loss column. While this is something that sounds like it should be fairly straightforward, it isn’t. Many investors often confuse what reflects as a current gain or loss for their performance data. There are several reasons why that is not the case.
Realized vs Unrealized
When reading the positions on your statement, you are reading exclusively unrealized gains or losses. This can make the performance information look better or worse.
Imagine that your advisor bought a position of 100 shares of Apple stock at $180 per share for a total of $18,000.
Six months later the advisor sells 80 of those shares for $230 per share for a total of $18,400, leaving you with the remaining 20 shares on your statement. Then another 6 months later Apple declines to $175 per share.
According to your statement you now own 20 shares of Apple at $175 per share, or $3,500 in total. Since those shares were originally purchased at $180 per share, that will reflect as a loss of $5 per share, or -$100.
However, the statement of positions doesn’t reflect that prior sale of 80 shares for $18,400 which was $400 more than your original investment. Once that sale was completed, you would have locked in a profit on the original transaction, and whatever happens with the remaining 20 shares is all gain. While these transactions will show in your account history from six months earlier, they do not reflect in your current balance. In such a scenario, you made money, but your current statement for accounting purposes reflects a loss.
The opposite can also be true.
Imagine a scenario where your advisor buys $10,000 worth of an S&P 500 index fund. The market subsequently declines substantially, and the fund is now worth $8,000. If this is in an non-retirement account, the advisor may do the prudent thing and sell the fund for the $2,000 tax loss, only to immediately buy something very similar, such as the Russell 1000 stock index. This is a strategy known as “tax-loss harvesting” whereas you maintain market participation but realize the loss for tax deductibility.
Now imagine that the new position in the Russell 1000 index fund appreciates from $8,000 to $9,000 dollars. The monthly statement you receive will show a position that reflects a gain of $1,000. However, while this is correct for accounting purposes, it is really a loss from the original $10,000 investment.
Accounting for Dividends & Interest
This is another area that can be confusing, particularly when it comes to bond funds. Since bonds in most years don’t fluctuate that much in price, the majority of the return that comes from a bond or bond fund is the interest payments that are collected, which typically reflects monthly in a bond fund.
If you purchased a bond fund for $10,000 and it paid a 5% interest payment annually that would mean a $41.66 payment monthly, or $500 annually. It’s fairly common for investors to own a fund for many years. If you opted not to reinvest the dividends, at the end of five years, you would have earned $2,500 in interest payments.
However, what if the value of that funds share price had declined from $10,000 to $9,500? On your monthly statement, you now reflect a loss of $500. In reality, you have a $2,000 gain when you add back the interest you’ve earned. Nevertheless, for accounting purposes your statement will correctly show a loss of $500, when in fact you actually made money.
The reinvestment of a dividend can cause a similar issue as each time you are buying more shares of an investment by acquiring these shares at what may be a higher, or lower price than your original purchase price. Each time you reinvest a dividend, you are altering your cost basis for accounting purposes.
Imagine the same example of a $10,000 bond fund purchase. You have now taken that same $2,500 in dividends payments, which are all 100% gains and added them in at new purchase prices each month.
The sum total of all the shares you acquired from reinvesting those dividends could be valued at $2,300, which is $200 less than the $2,500. This will reflect as a loss of $200 on your statement, yet in fact it is a gain of $2,300 since all of the purchases were the source of an already realized gain.
While to some this may seem complicated and confusing, it is little more than an accounting record. A monthly statement is just an accounting record of your unrealized gains and losses and does not reflect what has already been realized or closed out. The true measure of performance is the change in total market value over time once you’ve corrected for withdrawals and deposits.
Cost basis should only be used to calculate capital gains and losses for tax filing purposes, not to measure performance.
Filed under: Articles
Comments: Comments Off on Cost Basis vs Performance: How to Understand your Monthly Statement