When planning for financial security, life insurance is a critical tool to protect loved ones. However, choosing between term life insurance and permanent life insurance can be daunting. Especially when the guidance is often delivered by an insurance agent that is paid to sell insurance and has a vested interest in selling a more expensive product.
While permanent insurance (like whole or universal life) is often marketed as a lifelong solution with a savings component, buying term life insurance and investing the difference is typically a smarter financial strategy for most people, and here is why.
Understanding Term vs. Permanent Life Insurance
Term Life Insurance provides coverage for a specific period (typically 10, 20, or 30 years) at a fixed level premium. If the policyholder dies during the term, the beneficiaries receive a death benefit. If the term ends and the policyholder is still alive, the policy expires unless renewed (which will be at a higher cost). Term insurance is straightforward, more affordable, and focuses solely on providing a death benefit.
Permanent Life Insurance offers lifelong coverage as long as premiums are paid. It includes a cash value component that grows over time, which can be borrowed against or withdrawn. However, permanent policies are significantly more expensive due to this savings feature and complex fee structures.
Why Term Life and Investing the Difference Wins
Lower Premiums and More Savings to Invest
Term life insurance is dramatically cheaper than permanent insurance. For example, a healthy 30-year-old might pay $20–$30 per month for a 20-year, $500,000 term policy. A comparable whole life policy could cost $200–$300 per month or more.
The premium difference—potentially $150–$250 monthly—can be invested in low-cost, diversified options like index funds, ETFs, or using these options via retirement accounts with added tax benefits.
Over time, disciplined investing is likely to far outpace the cash value growth in permanent policies, which often deliver subpar returns due to high fees and conservative investment strategies.
Example: Investing $200 monthly at a 7% average annual return (which is typical long-term return for a diversified balanced portfolio) over 20 years could grow to approximately $98,000. In contrast, the cash value of a whole life policy might only reach $50,000–$60,000 after fees, assuming the same premium contributions.
Better Investment Returns
Permanent life insurance’s cash value grows slowly because insurers invest conservatively (often in bonds) and deduct substantial fees, including commissions, administrative costs, and mortality charges. Historical data from studies done by organizations like the Consumer Federation of America (CFA) shows whole life cash value returns averaging a mere 1–3% annually, far below the 6–8% long-term average of a balanced portfolio of low-cost investments.
By investing the potential premium savings in a diversified portfolio, you have control over your investments, can choose low-cost options, and benefit from market growth. Over decades, this compounding effect can build significant wealth, unlike the modest cash value in permanent policies.
Flexibility and Control
Term life insurance covers you during your highest-risk years—when you have young children, a mortgage, or significant debts. Once these obligations decrease, you often no longer need life insurance, freeing up funds for other goals. Investing the difference allows you to direct money toward retirement, college savings, or other priorities.
Permanent insurance, however, locks you into lifelong premiums. If you surrender the policy early, you may face penalties or lose much of the cash value. Additionally, accessing the cash value through loans or withdrawals reduces the death benefit and can trigger taxes, limiting flexibility.
Simpler and More Transparent
Term life insurance is easy to understand: you pay a premium, get coverage for a set period, and receive a death benefit if you die during the term. Permanent policies, by contrast, are complex, with opaque fee structures and projections that often overpromise returns. Many policyholders are surprised by how little cash value accumulates in the early years after hefty commissions and costs are deducted.
Investing separately in mutual funds, IRAs, or 401(k)s is also much more straightforward. You can track performance, adjust allocations, and avoid the hidden costs baked into permanent insurance by either evaluating the underlying investments yourself, or working with a trusted Fiduciary.
You Don’t Need Lifelong Coverage
Permanent insurance is sold on the premise that everyone needs life insurance forever. However, for most people, life insurance is a temporary need to protect dependents during working years. By the time a term policy expires, you may have paid off your mortgage, built substantial savings, or seen your children become financially independent. At that point, the need for a death benefit often diminishes. All of these are much more likely outcomes if you are a disciplined saver.
Investing the premium difference during the term should create a nest egg that replaces the need for insurance altogether later in life. Insurance is a contract of indemnity. That means it is there to replace a financial loss in the unfortunate event that one may occur. It is not a good mechanism for saving. If you are a disciplined saver, later in life you become less of a financial loss, and primarily an emotional loss.
When Permanent Insurance Might Make Sense
Permanent life insurance isn’t universally bad. It may suit specific situations, such as:
High-net-worth individuals in need of tax-advantaged estate planning tools to avoid issues such as estate taxes.
Business partners that may need to fund a buy-sell agreement well past the age in which term insurance is still a viable option.
In some cases, certain policies with long-term care riders can offer some estate planning benefits.
However, these cases are exceptions. For the average person, the high costs and low returns of permanent insurance far outweigh the benefits.
Buying Term
Determine Coverage Needs: Calculate how much life insurance you need based on debts, income replacement, and future expenses (possibly 10–12 times your annual income).
Shop for Term Insurance: Compare quotes from reputable insurers. Look for level-premium policies and consider taking a 30-year term. You can always cancel it early if it’s no longer needed. But the cost to add more years later will be more expensive.
Look for policies that are “guaranteed renewable” policies. If you are unfortunately diagnosed with a terminal illness just before the term expires, you’d likely want to extend it regardless of the exorbitant premium increase knowing the circumstances.
Review Regularly: Adjust your insurance and investment strategy as life changes (e.g., marriage, children, or paying off debts).
Common Objections and Rebuttals
“Permanent insurance is a forced savings plan.”
While it encourages saving, the high fees erode returns. A disciplined investor can save more effectively with better growth outcomes that are much more likely and added tax advantages. A good financial advisor should be guiding you to save more effectively, not telling you why you won’t be able to or how you’re likely to be derailed.
“What if I need coverage later in life?”
By investing the difference, you can build enough wealth to self-insure. If you still need coverage, you can purchase a new term policy if you’re young enough, or even convert some term policies to permanent ones (check for conversion options when buying).
“The cash value is tax-deferred.”
True, but so are IRAs, 401(k)s, and other retirement accounts, which offer better returns and lower costs. In addition, contributions to a qualified retirement plan will also reduce your current tax liability now by lowering your adjusted gross income (AGI). By lowering your AGI, you can also increase the eligibility to make further contributions to other tax advantaged accounts such as a ROTH IRA. The tax advantage of permanent insurance rarely justifies its expense.
For most people, buying term life insurance and investing the difference is a superior strategy to purchasing permanent insurance. Term policies provide affordable, ample coverage during your most vulnerable years, while investing the premium savings builds wealth more effectively than the cash value component of permanent policies. This approach offers flexibility, transparency, and higher returns, aligning with the goal of financial independence.
By focusing on term insurance for protection and disciplined investing for growth, you increase the chances of securing your family’s future without overpaying for a product that often benefits insurers and agents more than policyholders.
Filed under: Articles
Comments: Comments Off on Buy Term & Invest the Difference: Does it Make Sense
When you work with a financial advisor, you’re entrusting someone with your financial future, your savings, retirement plans, and long-term security. That relationship should be built on transparency, integrity, and education. Unfortunately, not every advisor operates with those priorities in mind.
There are certain phrases that should immediately raise red flags if you hear them from your financial professional.
Here are five things you should never hear from a financial advisor, and why.
“Performance Is the Only Thing That Matters”
Why it’s a problem:
While returns are important, they aren’t everything. A solid financial plan balances performance with risk, liquidity, tax implications, and alignment with your personal goals. Chasing high returns without regard for volatility, risk tolerance, or your own personal time horizon often leads to poor long-term outcomes.
An advisor who emphasizes performance above all else may be taking unnecessary risks with your portfolio or pushing products that benefit them more than you.
“You Don’t Need to Understand the Details…Just Trust Me”
Why it’s a problem:
Financial advice should empower you, not exclude you. An advisor should take the time to explain strategies, products, and recommendations in terms you can understand. If someone discourages questions or glosses over details, it’s a sign they may be hiding conflicts of interest or unsuitable investments. Or perhaps they simply don’t have the knowledge base and background to address your questions.
You don’t have to be an expert, but you deserve to feel informed and confident about where your money is going and why.
“You Don’t Need a Second Opinion.”
Why it’s a problem:
Any reputable advisor should be comfortable with you seeking a second opinion. In fact, they should welcome it. Financial planning and investment management are significant decisions, and it’s wise to verify that your strategy makes sense from more than one professional perspective.
If an advisor discourages this, it may be because they fear another expert would uncover issues, unnecessary risks, or excessive fees. A good advisor should be happy to see you seek another opinion, and then be happy to address the other advisors perspective, and why they prefer to possibly take a different route.
“This Is a Riskless Investment.”
Why it’s a problem:
There’s no such thing as a risk-free investment. Every financial product involves some form of risk — whether it’s market risk, credit risk, inflation risk, or liquidity risk. Even cash loses purchasing power over time due to inflation.
An advisor who claims an investment is riskless is either uninformed or providing misleading answers. A good financial professional will explain the potential downsides of every strategy and help you manage, rather than ignore those risks.
“Fees Don’t Matter”
Why it’s a problem:
There is a direct connection between the cost of investing and the performance of investments. Suggesting they don’t matter is misleading. That’s not to say that there aren’t acceptable levels of fees for certain products or services. In fact Vanguard has a study that shows that a good financial advisor can add 2-3% to long-term returns in comparison to what the average investor will achieve independtly.
All investment products come with some level of fees. As an example, the use of index funds and ETF’s still come with fees. However, these are nominal by comparison to that of other investment offerings in the marketplace. A good financial advisor is conscious of the cost of these products and will look to minimize them where they can.
A good advisor should also be fully transparent about their compensation. If an advisor brushes off the importance of portfolio expenses, or is not clearly addressing your questions on the topic, they may not be prioritizing your best interests. Investors that need guidance should consider a fee-only advisor that is not biased by hidden costs that will benefit the advisor as opposed to the client.
Your financial advisor should be your partner, educator, and advocate — not a salesperson relying on high pressure sales tactics. If you hear any of these five phrases, it’s time to reevaluate the relationship. Trustworthy financial guidance is built on transparency, open communication, and your best interests at heart.
Remember, it’s your money, your future, and your peace of mind. Don’t settle for less than honest, informed, and thoughtful advice.
Filed under: Articles
Comments: Comments Off on 5 Things You Should Never Hear from Your Financial Advisor
The Federal Reserve System, often referred to simply as “the Fed,” is one of the most powerful financial institutions in the world. Created over a century ago in response to recurring financial crises, its mission has evolved over time. While it was intended to stabilize the U.S. financial system, the Fed’s track record, particularly when it comes to maintaining the stability of the U.S. dollar is the subject of ongoing debate and criticism.
Why Was the Federal Reserve Created?
Before the Federal Reserve’s establishment in 1913, the U.S. banking system was fragmented, unstable, and prone to periodic financial panics. The most notable example was the Panic of 1907, a severe banking crisis that nearly collapsed the U.S. financial system. Without a central bank to act as a lender of last resort, private financiers like J.P. Morgan personally intervened to stabilize markets, a situation that policymakers agreed was unsustainable.
Congress created the Federal Reserve through the Federal Reserve Act of 1913 to address several key issues:
Provide a more elastic currency that could expand, or contract based on economic needs.
Serve as a lender of last resort to banks in times of financial distress.
Oversee and regulate the banking system to reduce the risk of financial panics.
Facilitate a smoother, more efficient national payments system.
Originally, the Fed was not tasked with directly managing inflation or employment — those mandates came years later.
What Does the Federal Reserve Do Today?
Today, the Fed’s responsibilities have broadened considerably. Its modern-day mandate, codified by Congress, is often summarized as the “dual mandate”:
Promote maximum employment
Maintain stable prices (inflation control)
In practice, the Fed also pursues financial system stability and moderates long-term interest rates. To do this, the Federal Reserve:
Sets short-term interest rates (through the federal funds rate)
Conducts open market operations (buying and selling government securities)
Regulates and supervises banks
Issues the U.S. dollar
Acts as a clearinghouse for financial transactions
Serves as a lender of last resort in times of crisis (as it did during the 2008 financial collapse and the 2020 COVID-19 pandemic)
The Fed’s tools, particularly its control over interest rates and money supply, give it enormous influence over the economy’s direction.
Why Has the Fed Struggled with Dollar Stability?
Though tasked with maintaining a stable dollar, the Federal Reserve has arguably done a poor job at preserving the purchasing power of the U.S. currency over the long term.
A Century of Dollar Decline
Since the Fed’s founding in 1913, the U.S. dollar has lost over 96% of its purchasing power. What a dollar could buy in 1913 would require more than $30 today. Much of this erosion has been the result of persistent inflation — a phenomenon that the Fed was supposed to guard against.
While a mild, predictable inflation rate is often considered healthy for economic growth, periods of high inflation — notably in the 1970s and early 1980s, and more recently after 2021, have had a destabilizing impact on the economy and diminished the value of savings.
Some economists argue that while the dollar buys less today, living standards, productivity, and wages have also risen over time. Technological progress and higher incomes have offset much of the burden of inflation. However, the benefits of that progress aren’t necessarily evenly distributed.
For savers and retirees relying on fixed incomes or dollar-denominated savings, inflation acts like a stealth tax, slowly eroding wealth. Asset holders (stocks, real estate, commodities) tend to fare better because their assets appreciate over time with inflation.
The Abandonment of the Gold Standard
For much of its early history, the dollar was tied to gold, which helped limit inflation and maintain currency stability. This changed in 1971 when President Richard Nixon ended the dollar’s convertibility to gold, severing the last direct link to a physical commodity.
Since then, the dollar has been a fiat currency, its value is backed only by government decree and market confidence. This gave the Fed broader discretion to manage the money supply and interest rates, but it also removed a key constraint against inflation.
It can be argued that it’s a track record of mismanagement: lower rates too long, ignoring asset bubbles, denying inflation risks, and then scrambling with drastic, market-roiling rate hikes when things go wrong.
It’s also important to note: the dollar was far more stable when it was tied to gold. The end of the gold standard in 1971 gave the Fed essentially unchecked power to create money out of thin air and some believe they’ve wielded that power with reckless abandon.
Unlike elected officials, the Fed faces no direct consequences for its failures, yet wields enormous power without the constraint of a monetary standard.
Monetary Expansion and Asset Bubbles
In response to financial crises (2008, 2020), the Fed aggressively expanded the money supply through quantitative easing and ultra-low interest rates. While these policies may have prevented immediate economic collapses, they also contributed to:
Inflated asset prices (stocks, real estate, bonds)
Rising wealth inequality
Long-term inflationary pressures now being felt in the 2020’s
Many critics argue that this monetary expansion, combined with persistent deficit spending by the federal government, has undermined the dollar’s stability both at home and abroad.
Dr. Milton Friedman argued the following:
“Inflation is always and everywhere a monetary phenomenon.
The mistake made by people on all sides is to believe that somehow or other, the Fed has been a source of stability. It has not. It has been a major source of instability.
The history of fiat money is the history of excess, inflation, and financial collapse.
The Government has three primary ways of controlling the economy: spending, regulation, and control of the money supply. The control of the money supply is by far the most dangerous because it can be done secretly, without anyone realizing what is happening. Inflation is the one form of taxation that can be imposed without legislation.”
The Federal Reserve was created to stabilize a fragile financial system, and it has succeeded in averting complete financial collapse multiple times. Yet, its broader record on preserving the value and stability of the U.S. dollar is far more questionable.
The dollar’s long-term decline in purchasing power, periods of runaway inflation, and increasing dependence on monetary intervention have raised legitimate concerns about the Fed’s role and effectiveness. As inflation once again became a central issue to the average American’s life, debates about the future of the Federal Reserve, and whether its structure and mandate still serve the public good are worth having. And discussions around returning to the gold standard, or some form of a monetary standard should be part of the discussion.
Filed under: Articles
Comments: Comments Off on The Federal Reserve: America’s Financial Firefighter or Fire Starter
Much of the news in the recent headlines has been on the topic of the tariffs imposed by President Trump on the imports from foreign nations which has caused a good degree of market volatility.
A tariff is simply a tax imposed by a government on goods and services imported from other countries, essentially increasing the price of those imported goods and services. As a result, the concern is that additional tariffs will add to inflation. Whether or not this is true remains to be seen. Historically inflation has been more of a function of the money supply. As we saw in 2021, the M2 money supply grew by a staggering 40% in just 18 months as a result of the policies of the Covid response, and inflation accelerated quickly.
Remember that in 2018 we saw similar tariffs imposed during the 1st Trump administration, and no such inflation occurred. The reason for this is likely because the motivation of the President’s position was not consistent with what occurred in 1930 with the Smoot-Hawley Tariff Act.
At that time, during the early stages of the Great Depression, the motivation was to limit free trade in an attempt to protect American industries. The thought was this would boost domestic production and employment. However, limiting free trade does not in fact protect American industry, but rather harms it. The reason is every nation has something it does better than others. The best way to grow both domestic and global commerce is to have goods and services produced in the most efficient way possible, which may mean that in some cases they are produced in the USA, and in some cases not.
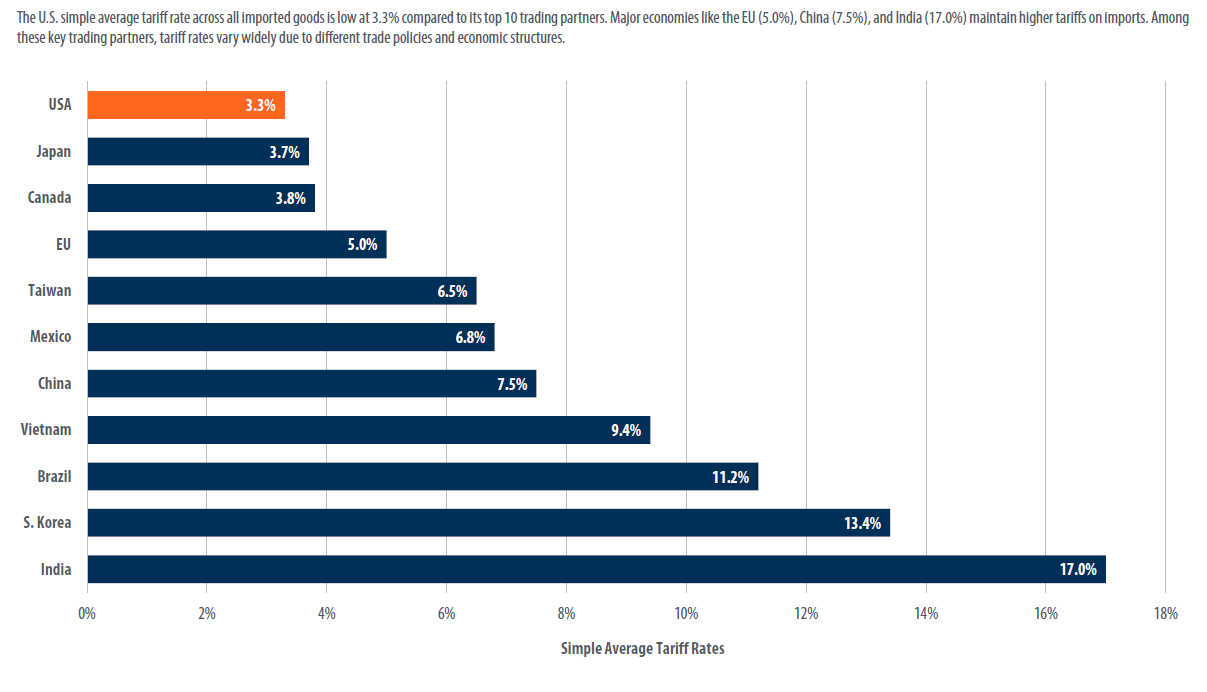
However, what is free trade? Free trade is a policy position that does not restrict imports or exports. The question is whether or not the USA has been engaging in free trade with its global trading partners. Looking at the chart above which shows the average tariff rate imposed by each nation, we can see that it is tough to argue that we have had a level playing field in terms of global trade for quite some time. While the USA has historically imposed 3.3% on average, the European Union has imposed a 50% higher tariff rate. India has been the worst offender among our global trade partners at 17%, which is more than 5 times the rate the USA has imposed. This begs the question, is this actually free trade?
This has contributed to a perpetually growing US trade deficit with most of the world. A trade deficit occurs when a nation imports more than it exports. The fundamental cause of a trade deficit is an imbalance between a country’s savings and investment rates. The reason for the deficit is the United States as a whole spending more money than it makes, which results in a current account deficit. That additional spending must, by definition, go towards foreign goods and services. Financing that spending happens in the form of either borrowing from foreign lenders (which adds to the U.S. national debt) or foreign investing in U.S. assets and businesses—the capital account.
However, in a true free market economy, trade deficits should swing back and forth between nations rather than moving consistently in one direction. There are many things that lead to a trade deficit. Some of the other causes that contribute to a trade deficit beyond tariffs are as an example:
More government spending, if it leads to a larger federal budget deficit, reduces the national savings rate and raises the trade deficit.
The exchange rate of the dollar is important, as a stronger dollar makes foreign products cheaper for American consumers while making U.S. exports more expensive for foreign buyers.
A growing U.S. economy also often leads to a larger deficit, since consumers have more income to buy more goods from abroad.
The data in the above chart is what the current administration seeks to change. What is important to point out is that the stated intent is not to create a protectionist economic environment similar to 1930, but rather to level the playing field. The question is…will the current administration be successful in any meaningful way? That remains to be seen.
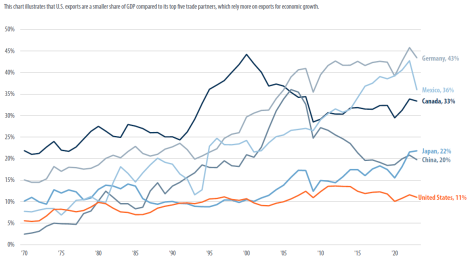
Perhaps they will be successful with some nations and not others. At this early stage, that can’t be known. However, what we can see below is that the same nations are generally much more dependent on exports as a share of their GDP than the United States, which is why the current administration believes they are negotiating from a position of strength.
As a result, the current administration believes that they can get other nations to lower their barriers to entry for USA exports. Time will tell if that happens. We have already seen some nations respond with a willingness to renegotiate, while others have imposed retaliatory tariffs.
If you put yourself in the position of an opposing politician, it can be difficult to immediately cut a deal with the administration because it may make you look weak, and harm you politically. It’s likely that many of the opposing hardline positions will soften in the coming weeks as the story leaves the headlines.
What does all this mean for markets? Not surprisingly, this has led to a quick decline in stocks as markets digest the possible impact to corporate earnings, and companies consider possible changes to their business strategy. However, at this point the decline, while unpleasant, is well within the range of historical market corrections and nothing unusual to date.
More importantly, other assets classes, such as fixed income are serving to buffer the volatility quite well, as the Barclays Aggregate Bond Index is positive approximately 3.50% year to date as of this moment. That is a bright spot in the recent volatility which suggests that while market declines are not fun, markets are functioning quite normally. In contrast, during the 2008 Financial Crisis, and the beginning of the Pandemic of 2020 the bond market declined rapidly along with stocks as the market experienced a liquidity crisis, leaving investors nowhere to hide. That is not happening at the moment, and the conservative arm of investor portfolios is doing exactly what it is supposed to do.
While we can’t tell you where the bottom of this particular downturn will be, we can say that there will be a bottom, and trying to time such events is as always, an exercise in futility. Eventually other nations will come to terms with the United States on aggregable tariffs rates for both sides, and we will see how much the terms change in favor of the USA, if at all.
In the meantime, the best answer is the same answer as in any other downturn, and that is to stick to your financial plan, as this period will also pass.
Filed under: Articles
Comments: Comments Off on The Trade War: What’s Happening?
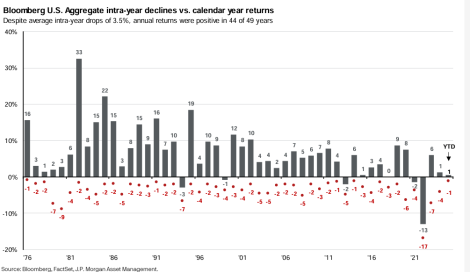
Looking at the bond market today, we can see that bond prices still haven’t fully recovered from the unprecedented decline of 2022. While 2022 is not that far behind us, let’s remember how unprecedented the decline actually was.
Over the last century the bond market has seen an average intra-year decline of approximately -3.5%, with the bond market turning positive approximately 92% of the time. This data shows that while bonds may not demonstrate the same long-term returns of stocks, they have always served as a good ballast to the inherent volatility of the stock market.
As we look at 2022, we saw an intra-year decline of approximately -17% with a final decline of -13% in the US Aggregate Bond Index. One would have to go back to the year 1787 to find a year that bad in the returns of US Bonds.
Since 2022, bond prices have stabilized as the Fed has reversed course on its aggressive rate hiking cycle, and bond prices have recovered somewhat. But what we can see from the data above is that bonds in general are still trading at a discount.
In order to correctly understand this, it’s important to understand how a bond is priced and where the return comes from. When you buy a bond, you are essentially loaning money to a government agency, or a company. They issue that bond at a stated interest rate, which is usually fixed, but not always. At a certain point in time that bond will mature, and you will receive back your principal, plus the interest payments annually while you wait. This is not unlike the process of buying a CD at the bank. However, a CD has FDIC insurance, whereas a bond is backed by the issuer, which in the case of government bonds can be the US government.
When a bond is first issued, it’s issued at what is called par value, which is either $100, $1,000 or $5,000. If par is $100 and you hold the bond until it matures, then you will receive back your par value of $100 regardless of how much it fluctuates prior to maturity. This also assumes that the issuer doesn’t default on the debt, which can happen with a corporate bond, but is extremely rare in tax-free municipal bonds.
However, bonds trade publicly among investors-both individuals and institutions. When the Fed raises rates, the bond that you bought at an interest rate of 3% looks less attractive when new bonds are issued at 4%. Therefore, if you’d like to sell your bond before it matures, you must take whatever discounted price the market offers, otherwise you can hold it until maturity. The discount the market demands will depend on a confluence of factors, such as how much time is left before it matures, the credit quality of the issuer, and how much rates have changed since it was issued.
The reverse could also be true if rates have come down since the bond was issued, then the bond would trade above $100 at a premium.
Remember that even if you have no intention of selling your bond and would prefer to hold it to maturity, your statement must reflect the current market price.
When looking at a bond index, this is a mathematical formula that represents a group of bonds for broad representation of the bond market. There are indices of the overall taxable bond market, municipal tax-free bond market, or other more narrow indices that focus just on areas such as high yield bonds, or exclusively government bonds. These indices give you a representation of how well or poorly the overall bond market is doing at any point in time.
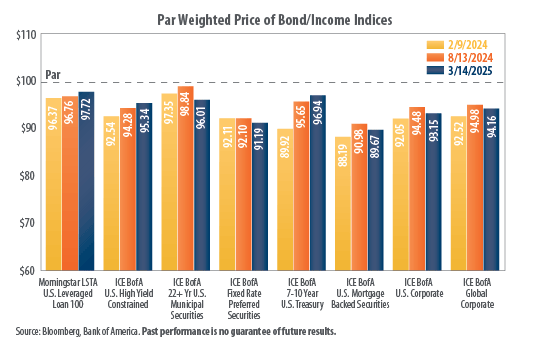
Looking at the data above courtesy of First Trust, we can see the trend since this time last year in many areas of the bond market. The data shows that bond prices have recovered in most areas since last year with the exception of long-term municipal bonds, and preferred securities which are not really bonds, but rather a hybrid of fixed income and stocks.
However, while there is a general improvement in the overall price of the bond market, we can see that the markets as a whole are still trading well below their par value. As an example, US mortgage-backed bonds are still trading close to 90 cents on the dollar. Other areas, such as the 7-10 year US Treasuries are closer to 96 cents on the dollar, and global corporate debt is closer to 94 cents on the dollar.
What this means is that as you buy into those areas, you are paying a discount. If you bought a 7-10 year treasury at 96 cents on the dollar, you will receive the full 100 cents at maturity when the 7-10 year has come due.
Many investors don’t buy individual bonds due to diversification concerns, nor do we. However, as we look at the current fixed income landscape, we can see that even after a solid recovery in bonds in 2023 and 2024, the overall bond market is still actively priced at a discount. This does not mean there is no room for further downside. Regardless of the circumstances, there is typically always a place for some degree of fixed income in most portfolios. But looking at the circumstances today, the bond market looks very well positioned for an asset class that typically has been very low volatility.
Filed under: Articles
Comments: Comments Off on The Bond Market: How Attractive is Fixed Income Today?
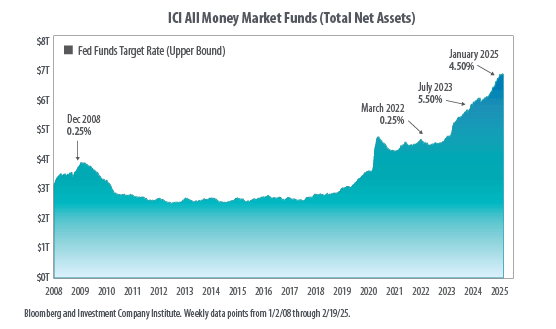
A review of money market balances has at times been looked at as a measure of whether or not the market is about to see a downward trend or an increase in the near term. The theory is that when there is a large amount of cash on hand, that cash is waiting to be deployed at the right opportunity. When there is less cash on hand, there isn’t enough cash to handle excess selling pressure.
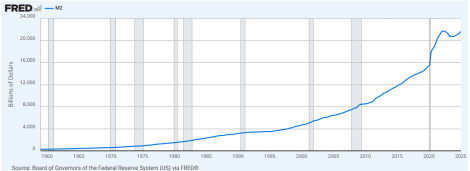
Looking at the chart above from Bloomberg, we can see that money market balances are at a record high in total value. The first thing to note is the explosion in the rate of growth in 2020 as the policy responses to the Covid lock downs began. The M2 money supply increased at an unprecedented rate of 40% in 18 months and continued to grow as seen in the below chart courtesy of the St Louis Federal Reserve. This led to the inevitable outcome of substantially higher inflation. Money market deposits are a component in the M2 measure of the money supply.
Today, money market balances are in excess of 6.9 trillion dollars. This is a 15% increase from this time last year. One might look at that data and extrapolate that we on the cusp of a great market rally. Some of this can be explained by the rapid rate increases in 2022 which caused dollars to begin to flee commercial banks for higher rates in money market alternatives.
A comparison of today versus prior years demonstrates the following:
2000
US GDP = 9.4 trillion
M2 money supply was 7.6 trillion – Approximately 51% of the size of the US economy
Money market balance were 1.8 trillion- Approximately 20% of the size of the US economy
2009
US GDP = 13.7 trillion
M2 money supply was 4.7 trillion – Approximately 55% of the size of the US economy
Money market balance were 3.4 trillion- Approximately 25% of the size of the US economy
2025
US GDP = 29.8 trillion
M2 money supply is 21.8 trillion – Approximately 73% of the size of the US economy
Money Market balances are 6.9 trillion – Approximately 23% of the size of the US economy
What we can see is that while money market balances are quite large, relative to the size of the US economy, they are actually lower than they were in 2009 and slightly higher than in 2000. Obviously, the US economy had just experienced a sizeable contraction in 2009, but on a relative basis, money markets are not that disproportionate to the current size of the economy on a relative basis.
The overall M2 money supply captures not just money markets, but other components such as cash, checking deposits, and other deposits readily convertible to cash, such as certificates of deposit, coins and currency in circulation, traveler’s checks, and savings accounts. When looking at this measure, M2 now amounts to approximately 73% of the size of the US economy, versus 2009 when it was closer to 55% of the US economy.
So, what does this mean? The first and most obvious thing it should mean is that the recent inflation experienced should not have been a surprise to the Federal Reserve or policy makers. The second thing to note is that this is still an elevated level by historical standards. That means that inflation is still a potential risk at those levels.
In terms of whether these historically high money market levels mean a positive or negative for the markets, it seems the answer might indicate a more neutral stance in the shorter term. Markets most certainly have a track record of long-term growth, and we never advocate for clients making financial planning decisions based on a short-term outlook. However, 6.9 trillion in money markets doesn’t have to mean that we are on the cusp of a big market rally in the short run, nor do we have to be. It simply looks like we are at typical levels that we have seen in years past.
Filed under: Articles
Comments: Comments Off on The Money Supply & Cash on Hand: What does it Mean for Markets?
Investors often refer to the stock market as gambling, no different than that of a casino. Well, we would agree with that sentiment. But not in the way most investors think. As most people are aware, when you enter a casino the odds of every game favor the casino, some by a wider margin than others. Simply put, while you may win sometimes, if you stay at the roulette wheel long enough, eventually you will lose. As they say, the house never loses, because it’s simply about statistical probability over time.
However, what if you can be the house instead of the player at the roulette table. While it may not be as exciting, it is certainly better financially. Well, when you invest in the stock market in a diversified way, you essentially become the house. You own the underlying businesses inside the fund that you bought.
As an investor any company can go out of business. However, presuming that you’re not buying a single company, or a very small number of companies, but instead have broad market diversification, the odds are dramatically in your favor. If you invest in the markets, you may lose in the short-term but if you stay invested long enough, the odds are dramatically in your favor. It is essentially the exact opposite of casino gambling from the perspective of the casino customer.
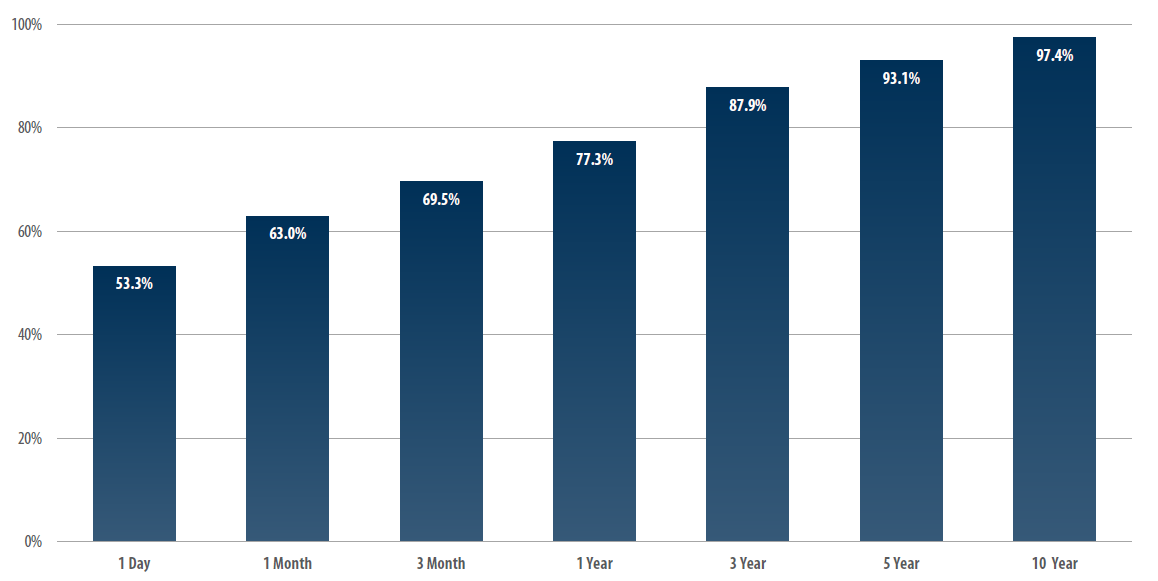
Well, how good are your odds?
Looking at the data above, courtesy of First Trust, we can see that on any given day your odds of an investment in the S&P 500 index yielding a positive result is a little better than a 50% chance. If you hold that same position for a month, the odds increase to better than 60%. After a year, it’s better than 75% of the time. If we look at a 10-year time frame, the probability jumps to better than 97%.
As we can see, the odds of making money in the longer term are excellent. This data is also based on a portfolio that is 100% in US Stocks. When other assets are introduced into an investment strategy, such as more conservative fixed income investments, the odds only get better. This is typically the case for most investors, especially those closer to retirement. In fact, there has never been a 10-year period in which a portfolio that is evenly balanced between stocks and bonds has posted a negative period.
As we suggested earlier, investing is like gambling in a casino, and you get to own the casino.
Filed under: Articles
Comments: Comments Off on Investing: Is it Gambling?
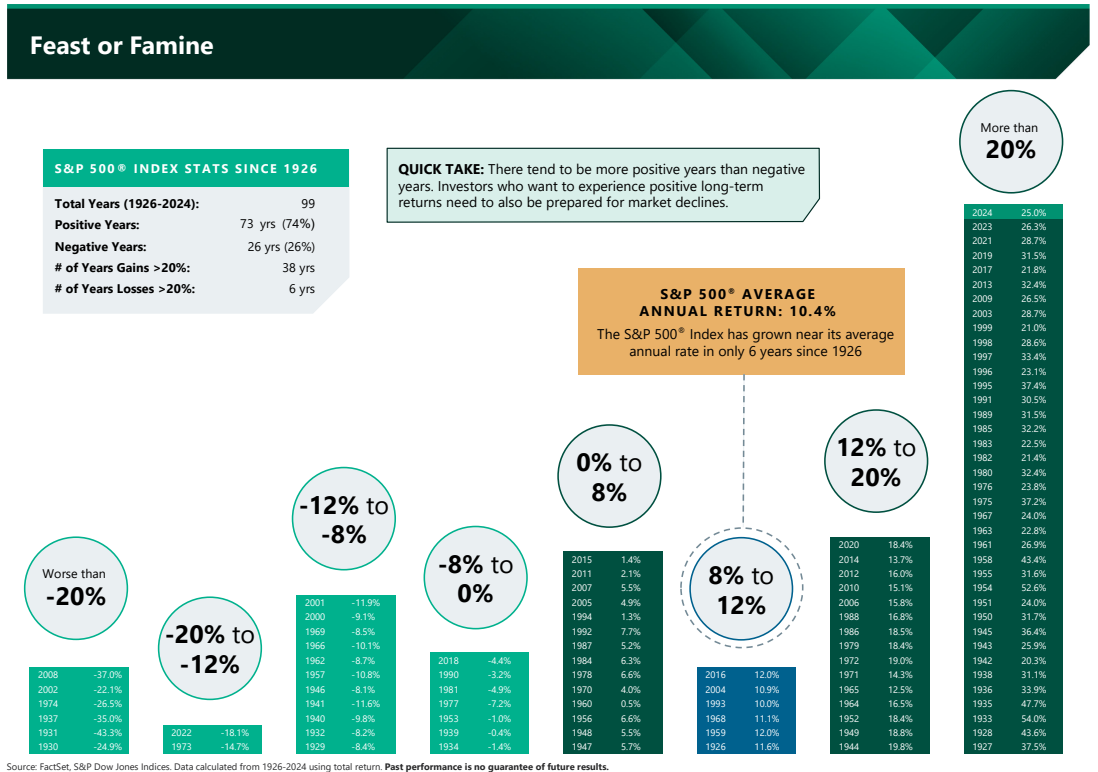
Over the years we have referred to various sources to demonstrate data points on the financial markets in past articles that strive to provide a better understanding of how markets have historically performed, and what type of volatility has accompanied this performance. In the illustration above, courtesy of AMG, we can see some interesting information about how market returns occur.
The first thing to clarify is that these numbers are the totals for each calendar year. The reason this is an important distinction is that at any given point, markets can have a higher peak or trough that differs from where the market finished the calendar year. As a result, this data is less relevant to market volatility, and more relevant to the importance of staying invested in order to weather historical volatility.
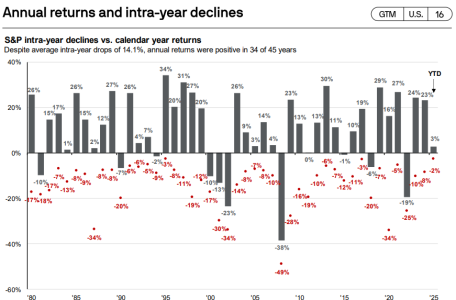
When looking at volatility, one can see that the intra-year volatility can be much steeper. As the below illustration courtesy of JP Morgan demonstrates, while markets are positive roughly 3 out of 4 years, the average intra-year decline is about -14% from the peak in the market.
What we can see is that 38 times since 1926 the S&P 500 has posted returns in excess of 20% for the calendar year. Yet only 6 times has the S&P 500 posted a negative return of -20% or more during that same duration of time. What you see is a similar result with each range, with the exception of the 8%-12% range of results. This tells us that while volatility is the norm, if we stick to our investments over time, the net result is a positive return in roughly 3 out of 4 years. Yet, there are years such as 2009 in which the S&P 500 posted a 23% return (26% with the dividend yield), but at one point was actually negative -28% for the year. What we can also see is that the most disproportionate results are in the positive/negative 20% or more range. This means that market results can often be “lumpy”. This is to say that market returns are not linear. As an example, in a theoretical year in which the S&P 500 has a price return of 12%, almost certainly the return would not be exactly 1% per month. In fact, it’s more likely to be 10% in one month, with the other 2% dispersed over the course of the year.
Investors can at times get discouraged when they don’t see immediate results or frightened during downturns. This is normal, as investing is often very emotional to the average investor. However, emotions are the enemy of investing, and a good investor is one that can think analytically or hire someone to do that for them.
Missing out on these “lumpy” periods of positive results can greatly skew the long-term results. This means successful investing comes with great discipline to see the longer-term likely outcome.
Filed under: Articles
Comments: Comments Off on Feast or Famine: Markets are Unpredictable