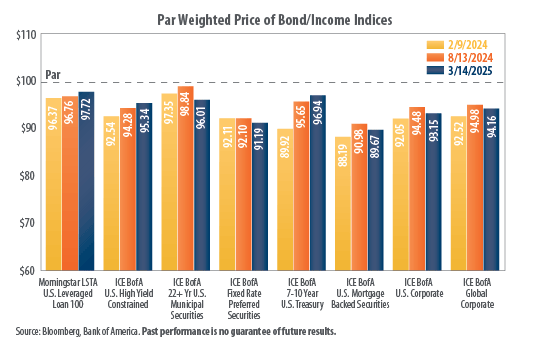
Looking at the bond market today, we can see that bond prices still haven’t fully recovered from the unprecedented decline of 2022. While 2022 is not that far behind us, let’s remember how unprecedented the decline actually was.
Over the last century the bond market has seen an average intra-year decline of approximately -3.5%, with the bond market turning positive approximately 92% of the time. This data shows that while bonds may not demonstrate the same long-term returns of stocks, they have always served as a good ballast to the inherent volatility of the stock market.
As we look at 2022, we saw an intra-year decline of approximately -17% with a final decline of -13% in the US Aggregate Bond Index. One would have to go back to the year 1787 to find a year that bad in the returns of US Bonds.
Since 2022, bond prices have stabilized as the Fed has reversed course on its aggressive rate hiking cycle, and bond prices have recovered somewhat. But what we can see from the data above is that bonds in general are still trading at a discount.
In order to correctly understand this, it’s important to understand how a bond is priced and where the return comes from. When you buy a bond, you are essentially loaning money to a government agency, or a company. They issue that bond at a stated interest rate, which is usually fixed, but not always. At a certain point in time that bond will mature, and you will receive back your principal, plus the interest payments annually while you wait. This is not unlike the process of buying a CD at the bank. However, a CD has FDIC insurance, whereas a bond is backed by the issuer, which in the case of government bonds can be the US government.
When a bond is first issued, it’s issued at what is called par value, which is either $100, $1,000 or $5,000. If par is $100 and you hold the bond until it matures, then you will receive back your par value of $100 regardless of how much it fluctuates prior to maturity. This also assumes that the issuer doesn’t default on the debt, which can happen with a corporate bond, but is extremely rare in tax-free municipal bonds.
However, bonds trade publicly among investors-both individuals and institutions. When the Fed raises rates, the bond that you bought at an interest rate of 3% looks less attractive when new bonds are issued at 4%. Therefore, if you’d like to sell your bond before it matures, you must take whatever discounted price the market offers, otherwise you can hold it until maturity. The discount the market demands will depend on a confluence of factors, such as how much time is left before it matures, the credit quality of the issuer, and how much rates have changed since it was issued.
The reverse could also be true if rates have come down since the bond was issued, then the bond would trade above $100 at a premium.
Remember that even if you have no intention of selling your bond and would prefer to hold it to maturity, your statement must reflect the current market price.
When looking at a bond index, this is a mathematical formula that represents a group of bonds for broad representation of the bond market. There are indices of the overall taxable bond market, municipal tax-free bond market, or other more narrow indices that focus just on areas such as high yield bonds, or exclusively government bonds. These indices give you a representation of how well or poorly the overall bond market is doing at any point in time.
Looking at the data above courtesy of First Trust, we can see the trend since this time last year in many areas of the bond market. The data shows that bond prices have recovered in most areas since last year with the exception of long-term municipal bonds, and preferred securities which are not really bonds, but rather a hybrid of fixed income and stocks.
However, while there is a general improvement in the overall price of the bond market, we can see that the markets as a whole are still trading well below their par value. As an example, US mortgage-backed bonds are still trading close to 90 cents on the dollar. Other areas, such as the 7-10 year US Treasuries are closer to 96 cents on the dollar, and global corporate debt is closer to 94 cents on the dollar.
What this means is that as you buy into those areas, you are paying a discount. If you bought a 7-10 year treasury at 96 cents on the dollar, you will receive the full 100 cents at maturity when the 7-10 year has come due.
Many investors don’t buy individual bonds due to diversification concerns, nor do we. However, as we look at the current fixed income landscape, we can see that even after a solid recovery in bonds in 2023 and 2024, the overall bond market is still actively priced at a discount. This does not mean there is no room for further downside. Regardless of the circumstances, there is typically always a place for some degree of fixed income in most portfolios. But looking at the circumstances today, the bond market looks very well positioned for an asset class that typically has been very low volatility.
Filed under: Articles
Comments: Comments Off on The Bond Market: How Attractive is Fixed Income Today?
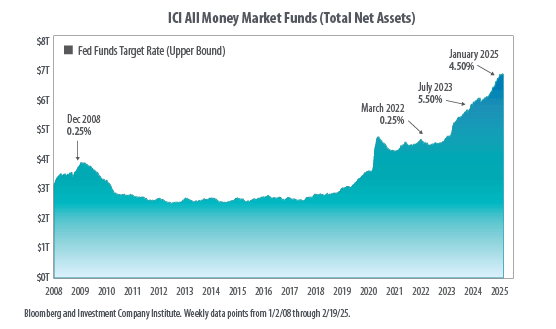
A review of money market balances has at times been looked at as a measure of whether or not the market is about to see a downward trend or an increase in the near term. The theory is that when there is a large amount of cash on hand, that cash is waiting to be deployed at the right opportunity. When there is less cash on hand, there isn’t enough cash to handle excess selling pressure.
Looking at the chart above from Bloomberg, we can see that money market balances are at a record high in total value. The first thing to note is the explosion in the rate of growth in 2020 as the policy responses to the Covid lock downs began. The M2 money supply increased at an unprecedented rate of 40% in 18 months and continued to grow as seen in the below chart courtesy of the St Louis Federal Reserve. This led to the inevitable outcome of substantially higher inflation. Money market deposits are a component in the M2 measure of the money supply.
Today, money market balances are in excess of 6.9 trillion dollars. This is a 15% increase from this time last year. One might look at that data and extrapolate that we on the cusp of a great market rally. Some of this can be explained by the rapid rate increases in 2022 which caused dollars to begin to flee commercial banks for higher rates in money market alternatives.
A comparison of today versus prior years demonstrates the following:
2000
US GDP = 9.4 trillion
M2 money supply was 7.6 trillion – Approximately 51% of the size of the US economy
Money market balance were 1.8 trillion- Approximately 20% of the size of the US economy
2009
US GDP = 13.7 trillion
M2 money supply was 4.7 trillion – Approximately 55% of the size of the US economy
Money market balance were 3.4 trillion- Approximately 25% of the size of the US economy
2025
US GDP = 29.8 trillion
M2 money supply is 21.8 trillion – Approximately 73% of the size of the US economy
Money Market balances are 6.9 trillion – Approximately 23% of the size of the US economy
What we can see is that while money market balances are quite large, relative to the size of the US economy, they are actually lower than they were in 2009 and slightly higher than in 2000. Obviously, the US economy had just experienced a sizeable contraction in 2009, but on a relative basis, money markets are not that disproportionate to the current size of the economy on a relative basis.
The overall M2 money supply captures not just money markets, but other components such as cash, checking deposits, and other deposits readily convertible to cash, such as certificates of deposit, coins and currency in circulation, traveler’s checks, and savings accounts. When looking at this measure, M2 now amounts to approximately 73% of the size of the US economy, versus 2009 when it was closer to 55% of the US economy.
So, what does this mean? The first and most obvious thing it should mean is that the recent inflation experienced should not have been a surprise to the Federal Reserve or policy makers. The second thing to note is that this is still an elevated level by historical standards. That means that inflation is still a potential risk at those levels.
In terms of whether these historically high money market levels mean a positive or negative for the markets, it seems the answer might indicate a more neutral stance in the shorter term. Markets most certainly have a track record of long-term growth, and we never advocate for clients making financial planning decisions based on a short-term outlook. However, 6.9 trillion in money markets doesn’t have to mean that we are on the cusp of a big market rally in the short run, nor do we have to be. It simply looks like we are at typical levels that we have seen in years past.
Filed under: Articles
Comments: Comments Off on The Money Supply & Cash on Hand: What does it Mean for Markets?
Investors often refer to the stock market as gambling, no different than that of a casino. Well, we would agree with that sentiment. But not in the way most investors think. As most people are aware, when you enter a casino the odds of every game favor the casino, some by a wider margin than others. Simply put, while you may win sometimes, if you stay at the roulette wheel long enough, eventually you will lose. As they say, the house never loses, because it’s simply about statistical probability over time.
However, what if you can be the house instead of the player at the roulette table. While it may not be as exciting, it is certainly better financially. Well, when you invest in the stock market in a diversified way, you essentially become the house. You own the underlying businesses inside the fund that you bought.
As an investor any company can go out of business. However, presuming that you’re not buying a single company, or a very small number of companies, but instead have broad market diversification, the odds are dramatically in your favor. If you invest in the markets, you may lose in the short-term but if you stay invested long enough, the odds are dramatically in your favor. It is essentially the exact opposite of casino gambling from the perspective of the casino customer.
Well, how good are your odds?
Looking at the data above, courtesy of First Trust, we can see that on any given day your odds of an investment in the S&P 500 index yielding a positive result is a little better than a 50% chance. If you hold that same position for a month, the odds increase to better than 60%. After a year, it’s better than 75% of the time. If we look at a 10-year time frame, the probability jumps to better than 97%.
As we can see, the odds of making money in the longer term are excellent. This data is also based on a portfolio that is 100% in US Stocks. When other assets are introduced into an investment strategy, such as more conservative fixed income investments, the odds only get better. This is typically the case for most investors, especially those closer to retirement. In fact, there has never been a 10-year period in which a portfolio that is evenly balanced between stocks and bonds has posted a negative period.
As we suggested earlier, investing is like gambling in a casino, and you get to own the casino.
Filed under: Articles
Comments: Comments Off on Investing: Is it Gambling?
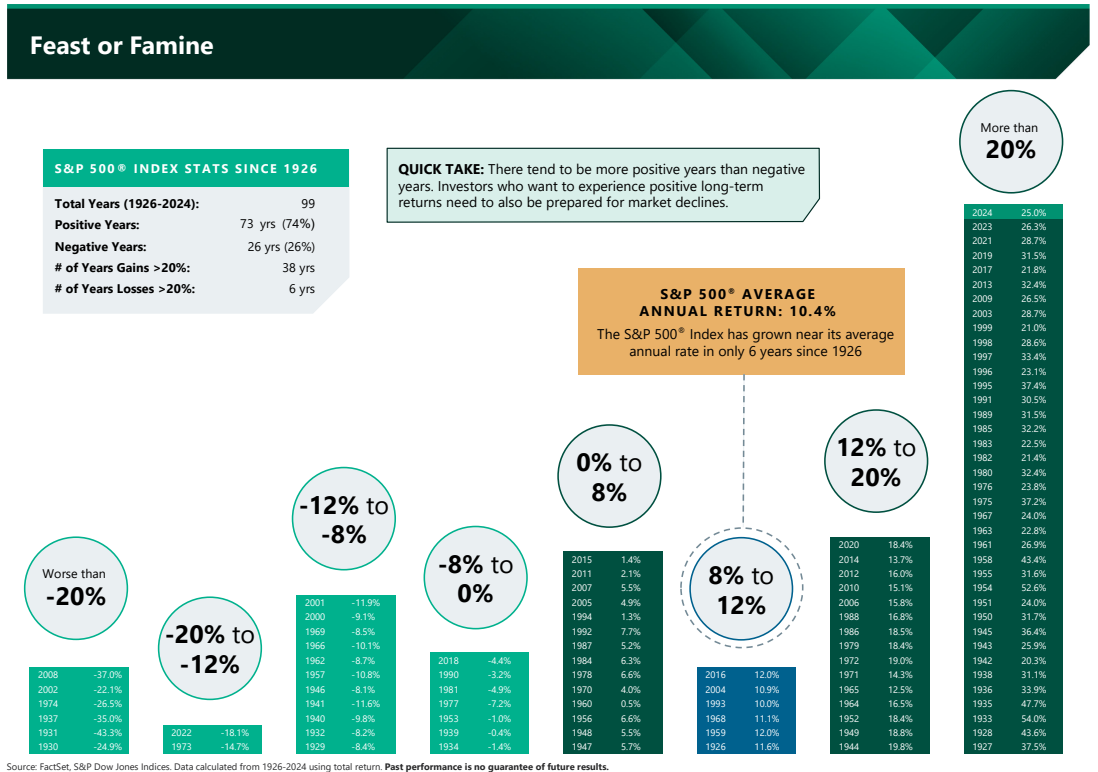
Over the years we have referred to various sources to demonstrate data points on the financial markets in past articles that strive to provide a better understanding of how markets have historically performed, and what type of volatility has accompanied this performance. In the illustration above, courtesy of AMG, we can see some interesting information about how market returns occur.
The first thing to clarify is that these numbers are the totals for each calendar year. The reason this is an important distinction is that at any given point, markets can have a higher peak or trough that differs from where the market finished the calendar year. As a result, this data is less relevant to market volatility, and more relevant to the importance of staying invested in order to weather historical volatility.
When looking at volatility, one can see that the intra-year volatility can be much steeper. As the below illustration courtesy of JP Morgan demonstrates, while markets are positive roughly 3 out of 4 years, the average intra-year decline is about -14% from the peak in the market.
What we can see is that 38 times since 1926 the S&P 500 has posted returns in excess of 20% for the calendar year. Yet only 6 times has the S&P 500 posted a negative return of -20% or more during that same duration of time. What you see is a similar result with each range, with the exception of the 8%-12% range of results. This tells us that while volatility is the norm, if we stick to our investments over time, the net result is a positive return in roughly 3 out of 4 years. Yet, there are years such as 2009 in which the S&P 500 posted a 23% return (26% with the dividend yield), but at one point was actually negative -28% for the year. What we can also see is that the most disproportionate results are in the positive/negative 20% or more range. This means that market results can often be “lumpy”. This is to say that market returns are not linear. As an example, in a theoretical year in which the S&P 500 has a price return of 12%, almost certainly the return would not be exactly 1% per month. In fact, it’s more likely to be 10% in one month, with the other 2% dispersed over the course of the year.
Investors can at times get discouraged when they don’t see immediate results or frightened during downturns. This is normal, as investing is often very emotional to the average investor. However, emotions are the enemy of investing, and a good investor is one that can think analytically or hire someone to do that for them.
Missing out on these “lumpy” periods of positive results can greatly skew the long-term results. This means successful investing comes with great discipline to see the longer-term likely outcome.
Filed under: Articles
Comments: Comments Off on Feast or Famine: Markets are Unpredictable