2025: Important Retirement Plan and Tax Law Changes

By info@landmarkwealthmgmt.com,

As the calendar turns to the new year, things rarely stay the same, and that applies to financial planning, as tax laws and retirement plan changes evolve.  This year there will be some impactful retirement plan changes from the Secure Act 2.0, which was passed in late 2022.  Also, there are increased limits and thresholds for retirement accounts along with other notable changes.  This is a highlight of some of the upcoming changes.


The Secure Act 2.0 is still providing benefits to retirement savers.  Starting this year retirement plans will allow for a “Super Catch-Up.  This Enhanced Catch-Up allows savers that are aged 60 to 63, to add an additional amount to their 401k, 403b, 457 or SIMPLE IRA.


In the case of the 401k, 403b & 457 plans the catch-up amount will increase from $7,500 to $11,250 for those ages 60-63 and will be indexed for inflation beginning in 2026.


In the case of the SIMPLE IRA, the limit increases to $16,500 and the catch up is $3,500 for those 50 and older.  However, the “Super Catch Up” further increases the contribution from $3,500 to $5,250 for those ages 60-63.


Other notable changes to new 401k and 403b plans are automatic enrollment and automatic portability.  If a new 401k or 403b is established, employees must automatically be enrolled and started with a 3% minimum enrollment contribution.


Standard plan limits have also increased for qualified retirement plans.  Employee contribution limits have increased to $23,500.  The catch up for 50 or older is $7,500 unless the employee is eligible for the “Super Catch Up” referenced earlier.


The Section 415 limit, which is the maximum total contribution for qualified plans for 2025 is $70,000 plus your catch up.


Individual Retirement Account (IRA’s) limits remain the same at $7,000 and the Catch-Up contribution for those 50 and older remains at $1,000.


Health Savings Account limits increase to $4,300 for an Individual and $8,550 for a Family.  The Catch-Up contribution for ages 55 or older is an additional $1,000.


The Qualified Charitable Distribution limit in 2025 is $108,000.  A Qualified Charitable Distribution is the maximum annual amount that someone 70.5 or older can distribute out of an IRA to charity and avoid income taxes.


Medicare Part B Premium will increase to $185 per month per person. The first IRMAA (Income Related Monthly Adjustment Amount) will start when your Modified Adjusted Gross Income (MAGI) exceeds $106,000 for single filers and $212,000 for married filing jointly.


Medicare Part D outlays are now capped at $2,000.


The Social Security cost of living increase for 2025 is 2.5%.  The average increase for recipients is $45.


The annual gift exclusion increases this year to $19,000 per person.


The Federal Estate Exclusion increases to $13,990,000.


The Standard Deduction in 2025 will be $15,000 for Single filers and $30,000 for Married Filing Joint.  The additional deduction for ages 65 or older is $1,600 ($2,000 for those unmarried who are not a surviving spouse).


The Child Tax Credit remains at $2,000, with $1,700 being refundable.


This provides just a brief overview of some of the more notable changes to 2025.  It’s important to remember that with a new administration, as well as a new congress set to take office, there will likely be some additional changes to the tax code moving forward into 2025.   As always, we would suggest that individuals speak not only to their financial planner, but also contact your tax professional to see how these changes may impact you.

  Filed under: Articles
  Comments: Comments Off on 2025: Important Retirement Plan and Tax Law Changes


S&P Stock Concentration: What Does History Tell Us?

By info@landmarkwealthmgmt.com,

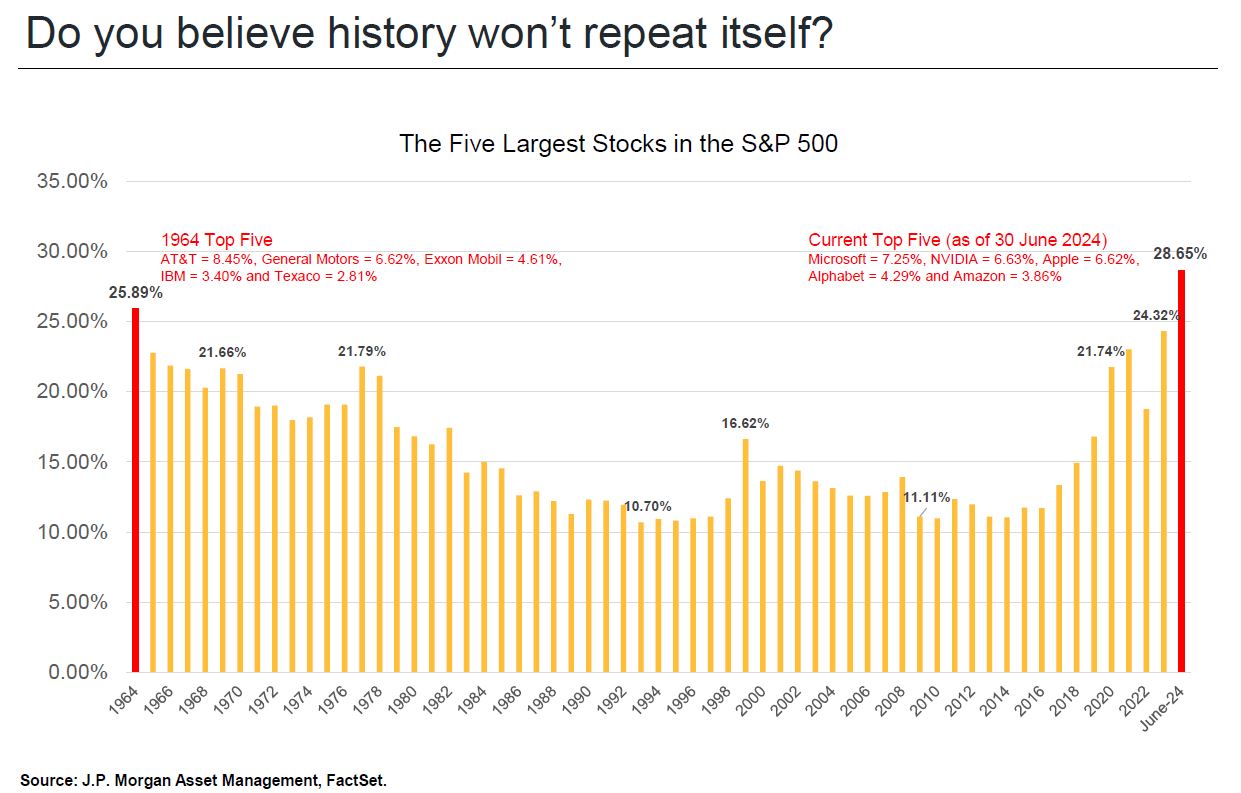
Most investors have heard of market indices such as the S&P 500 or the Dow Jones Industrials, but not all know exactly what that means.    Market indices can be constructed differently.  But in the case of the S&P 500 index it is a mathematical formula of the top 500 public companies in the United States weighted by market capitalization (cap).


The market cap is determined by multiplying the price of a stock by the number of shares outstanding.  This produces market cap numbers in the billions and in some cases trillions when it comes to the S&P 500.


The way in which the S&P 500 is built, the larger the market cap of a particular company, the more proportionate representation they receive in the index.   As an example, Microsoft makes up more than 7% of the S&P 500, while a company like Caterpillar makes up less than 0.50% of the index.   This means that the more a stock gains in price above the rest of the market, the more it will gain representation in the index.  This formula has proven very successful over time, as beating the overall index has been proven to be nearly an impossible feat over any significant length of time.


However, at different points in time, this has led to significant concentrations in a few stocks that have significantly outperformed the overall markets.  While that might be a fun ride up, it can lead to some increased risk in a less diversified portfolio.


At the moment, we are living through just such a period.   As the data provided by JP Morgan demonstrates, the top 5 companies in the S&P 500 make up about 28% of the overall index.   That means if you invested $100 dollars in an S&P 500 index fund, $28 dollars would be invested in just those 5 companies, which is less diversified than most might imagine.


This level of concentration has not been seen since the mid-1960’s as we can see from the chart above.    The last time this happened, the degree of concentration steadily declined over the next three decades.


In order for this concentration to decline, this means that either those top stocks have to decline, or they grow slower than the remaining companies in the index over time, or some combination of the two.   In the long run, typically what happens is the rest of the market begins to catch up.  However, in the short term, it could mean that there is an actual price decline in such concentrated holdings.


It’s difficult to predict what the short term will mean for the markets, and even more difficult when evaluating a group of just 5 companies.   What we can do is look back at history and see that when a small group of names lead the market in such a significant way, this tends not to be sustainable.


Such data reinforces the need for a well-diversified portfolio that maintains exposure to numerous areas of the markets, including other asset classes.   This doesn’t mean that there must be an immediate reversion back to a more balanced index.  However, if history is any reliable indicator of what is to eventually come, that seems inevitable, and diversification will become even more important as markets begin to broaden out, and the biggest names do not necessarily continue to remain the leaders.


  Filed under: Articles
  Comments: Comments Off on S&P Stock Concentration: What Does History Tell Us?