
U.S. government shutdowns occur when Congress fails to pass funding legislation, halting non-essential federal operations and furloughing hundreds of thousands of workers. Since the 1970s, there have been more than 20 such events, ranging from a single day to over a month in duration. While these disruptions can create uncertainty, historical data reveals a muted and often negligible effect on the stock market, with the S&P 500 showing resilience and quick recoveries in most cases.
Early Shutdowns: Volatility in the 1970s and 1980s
The first significant wave of shutdowns hit in the late 1970s and early 1980s, coinciding with economic challenges like stagflation and high interest rates. From 1976 to 1982, there were nine brief shutdowns, many lasting just a day or two. During this period, market reactions were mixed, with the S&P 500 posting gains in about half the instances but experiencing sharper declines in others.
The most notable outlier was a 1979 shutdown, when the index fell more than 6% amid broader economic woes. Overall, these early events contributed to an average S&P 500 decline of around 1.6% across shutdowns over the past 50 years, though much of the downside was concentrated in the turbulent 1970s. By the 1980s, as shutdowns became shorter and less frequent, market impacts lessened, setting a precedent for the more benign reactions seen later.
The 1990s: A Mixed Bag Amid Partisan Standoffs
The mid-1990s marked a shift toward longer shutdowns driven by budget battles between a Republican Congress and President Bill Clinton. There were two major events in late 1995 and early 1996: one from November 14 to 19, 1995 (5 days), during which stocks rose modestly, and another from December 16, 1995, to January 6, 1996 (21 days), which saw the S&P 500 drop 3.7% as investors worried about fiscal gridlock.
These were the longest shutdowns at the time and tested market nerves, but the declines were short-lived. The S&P 500 rebounded quickly after resolutions, gaining ground within weeks. Notably, 1995 marked the last time the index declined during a shutdown until earlier periods; since then, performance has trended positively.
The 21st Century: Resilience in the Face of Prolonged Disruptions
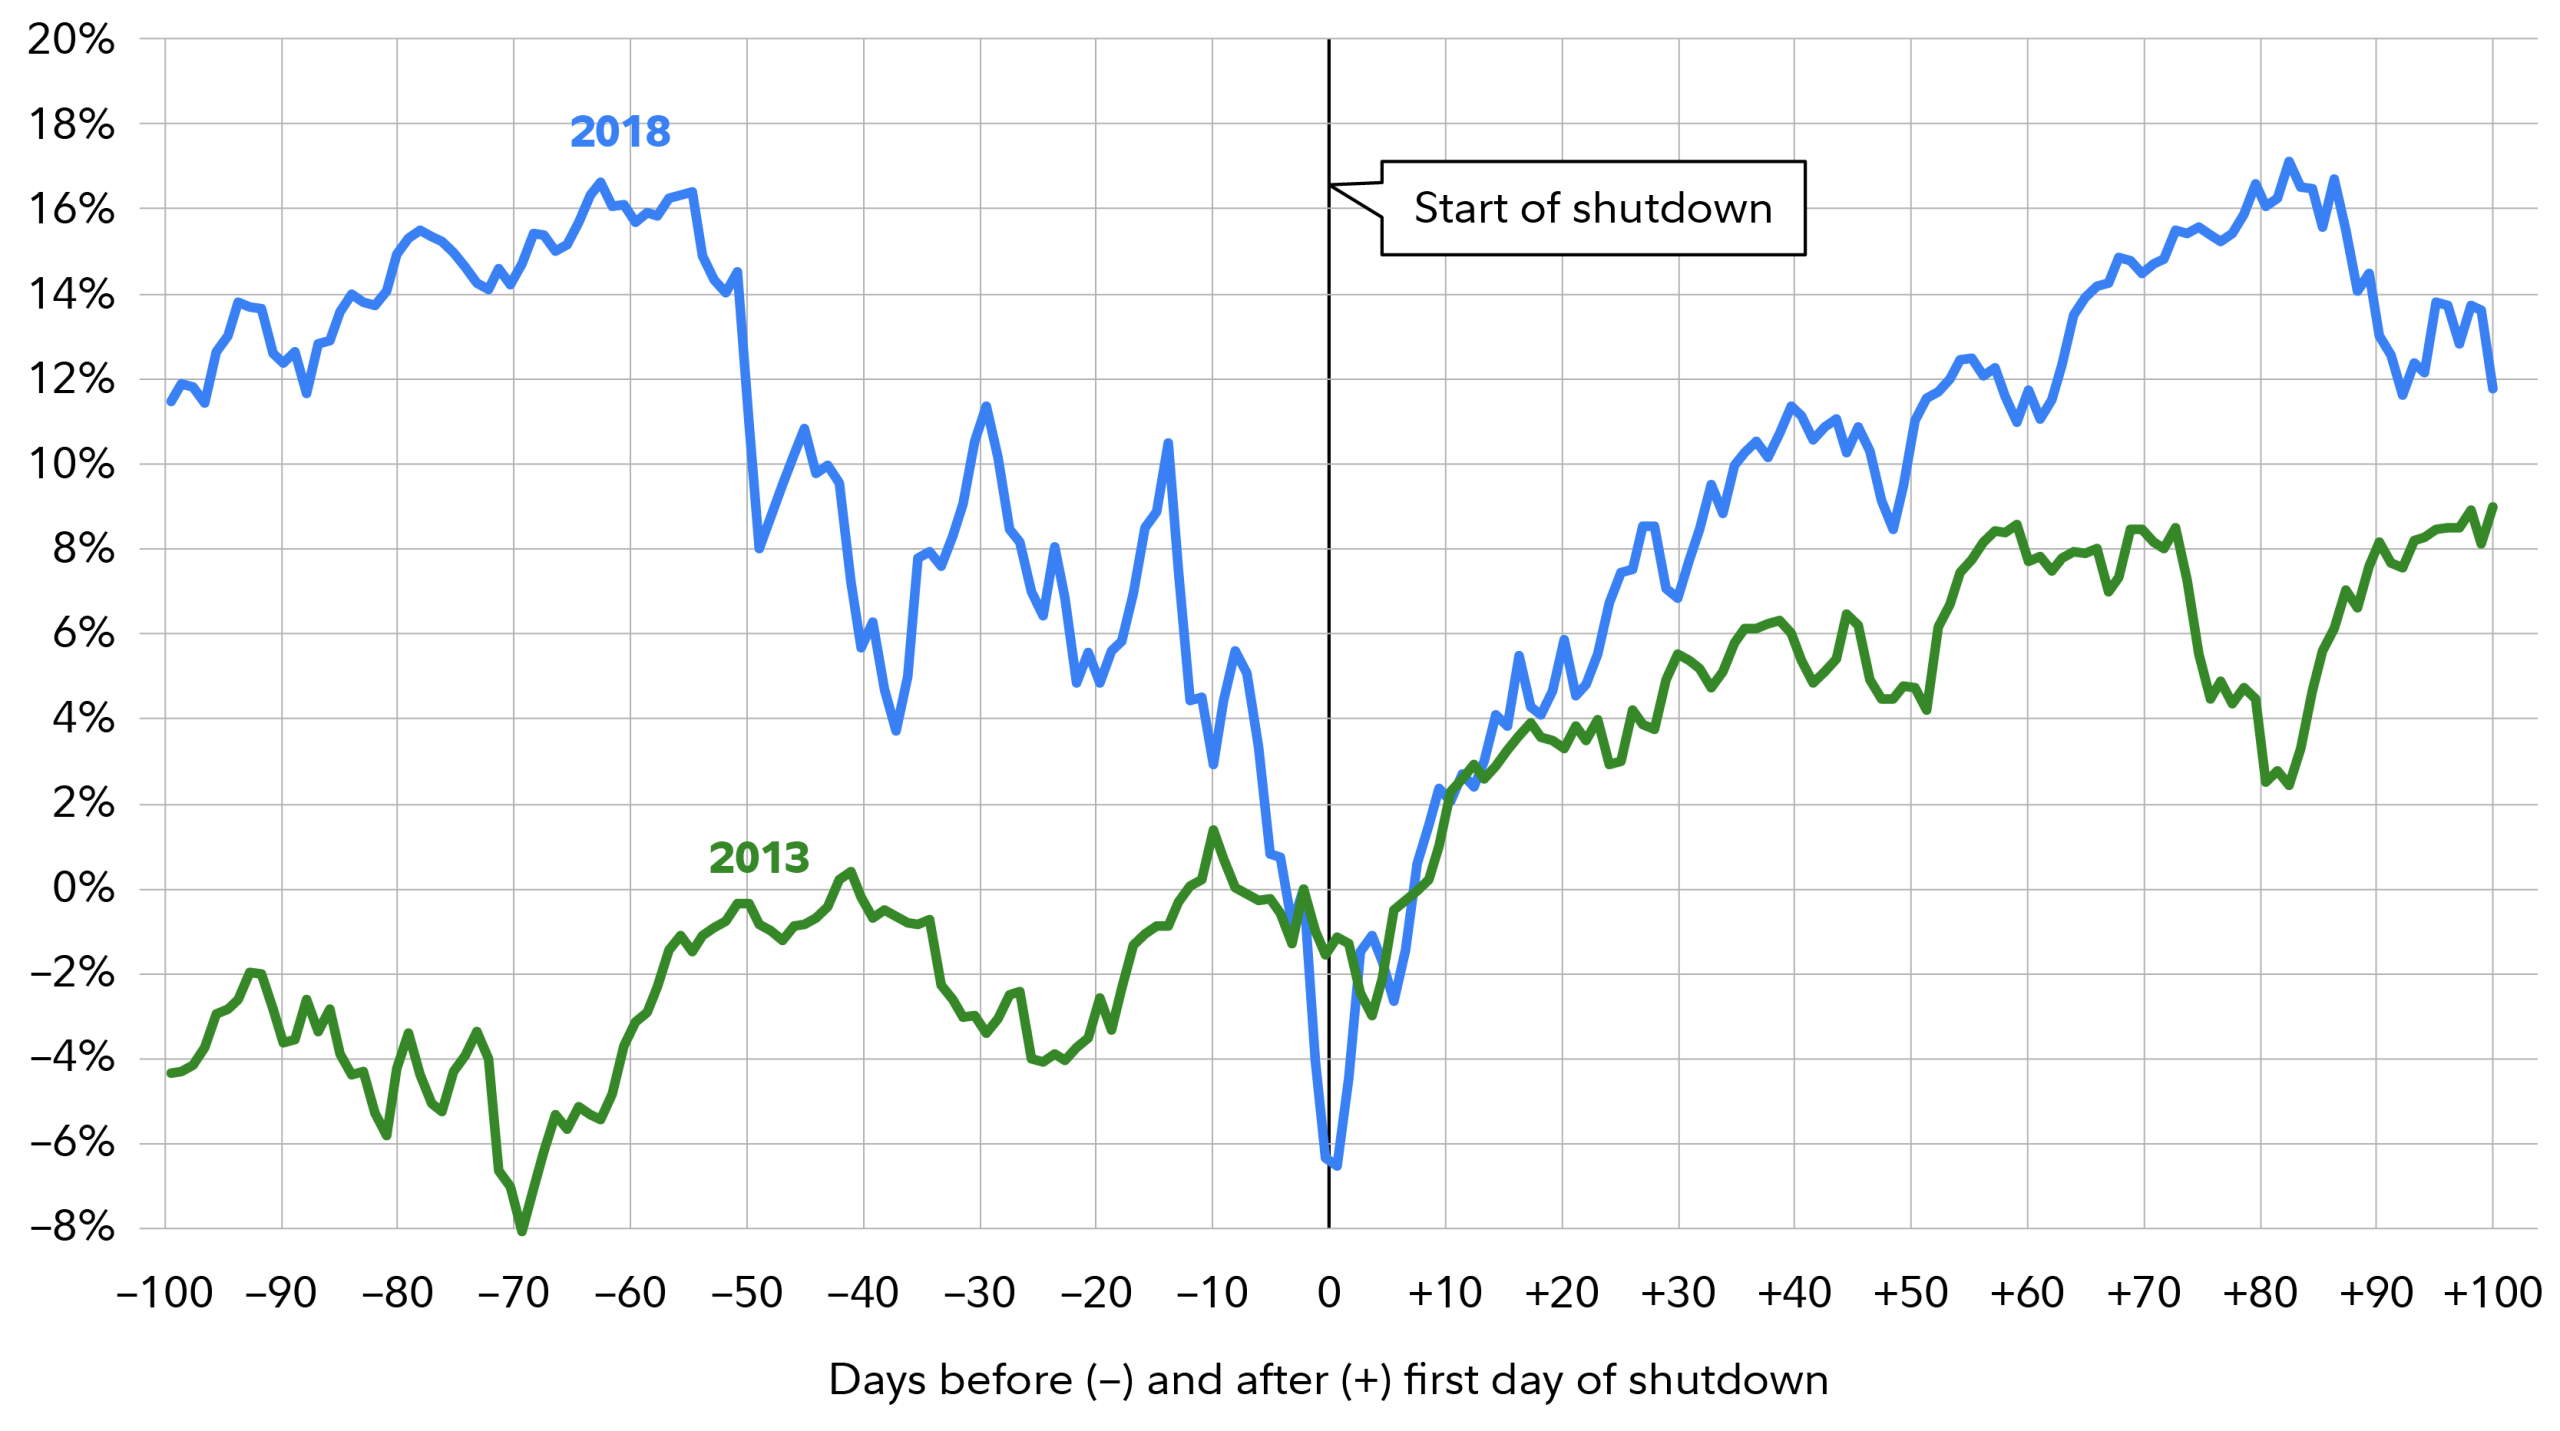
Modern shutdowns have generally coincided with stronger market showings. The 2013 standoff, lasting 16 days from October 1 to 17 over the Affordable Care Act and debt ceiling, saw the S&P 500 climb 3.1% despite initial jitters. Investors shrugged off the drama, focusing instead on improving economic data.
The record-breaking 2018-2019 shutdown, from December 22, 2018, to January 25, 2019 (35 days), stemmed from disputes over border wall funding under President Donald Trump. Far from derailing markets, the S&P 500 surged more than 10% during this period, buoyed by a dovish pivot from the Federal Reserve that eased rate hike fears. This event underscored how broader monetary policy often overshadows shutdown noise.
Patterns and Broader Lessons
Across 22 shutdowns since 1976, the S&P 500 has averaged nearly flat performance during the closures themselves, with gains in more than half the cases. The maximum drawdown since 1980 has been just 2.2%, highlighting limited downside risk. Since 1990, the index has risen during every shutdown, averaging a slight uptick of 0.3%.
Post-shutdown, markets typically strengthen: the S&P 500 has gained an average of 1.2% one month after resolutions and 2.9% three months later, with one-year returns averaging around 12-17%. Short-term volatility is common, especially in longer shutdowns, but long-term trends remain intact, driven by corporate earnings and global factors rather than D.C. dysfunction.
Economically, shutdowns trim GDP growth by about 0.2-0.6% per week, but stock markets, forward-looking by nature, discount these temporary hits, but diversified portfolios weather the storm.
In terms of fixed income, a brief shutdown of government agencies poses little risk to fixed income investments as tax revenue is still being collected. However, a prolonged shutdown could theoretically have a negative impact on the U.S. credit rating. Yet, if the shutdown leads to longer term substantive fiscal reforms, it could possibly help the U.S. credit rating in the years to come.
Looking Ahead: Why History Suggests Calm
The current potential shutdown could be prolonged amid ongoing partisan divides, but history advises against overreaction. Shutdowns rarely alter the market’s trajectory; instead, they serve as reminders to focus on fundamentals like earnings growth and interest rates. Investors who stayed the course during past events were rewarded with recoveries, reinforcing that these political theater pieces, while disruptive, are footnotes in the grander bull and bear narratives of Wall Street.
In fact, looking at the chart above courtesy of Fidelity Investments, we can see that the 100 days after two of the longest shutdowns in recent history showed strong market results. For most citizens, it will have little impact on their day-to-day life as essential services such as the military, air traffic control, postal services and TSA roles continue as normal. So, the planes will take off and land without interruption to most forms of commerce and have a limited impact on the overall economy.
About the Author
Joseph M. Favorito, CFP® is a Certified Financial Planner® as well as the founder and managing partner at Landmark Wealth Management, LLC, a fee-only SEC registered investment advisory firm. He specializes in helping individuals and families develop comprehensive financial strategies to achieve their long-term goals.