
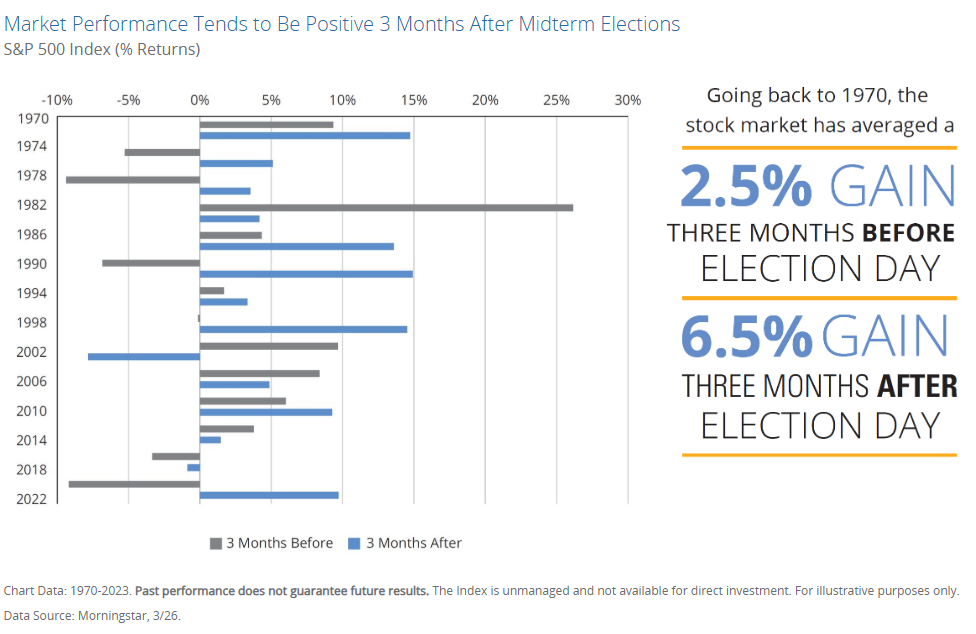
Midterm elections often bring political uncertainty, but history shows that the stock market has frequently delivered its strongest gains in the three months following these pivotal votes. A new analysis of S&P 500 returns from Hartford funds dating back to 1970 reveals a clear pattern: the index has averaged a 6.5% gain in the three months after midterm Election Day, compared to a more modest 2.5% average gain in the three months leading up to it.
Decades of Data: Stronger Post-Midterm Returns
The chart above illustrates S&P 500 performance surrounding every midterm election since 1970. Blue bars represent the three-month period after Election Day, while gray bars show the three months before.
Key takeaways from the historical data:
- Post-midterm periods (blue) are positive in the vast majority of cycles.
- Several years show double-digit gains in the three months following the election.
- Pre-election periods (gray) are more mixed, with occasional notable declines as uncertainty builds.
Notable strong post-midterm performances include robust rallies in cycles such as 1974, 1998, 2002, and 2010. Even in more challenging environments, the three-month window after midterms has tended to favor bulls.
Why Does the Market Perform Better After Midterms?
Several factors help explain this historical tendency:
- Resolution of Uncertainty – Markets dislike prolonged political gridlock. Once control of Congress is decided, investors can better anticipate policy direction on taxes, regulation, spending, and trade.
- Seasonal and Cyclical Tailwinds – Midterms occur during the second year of a presidential term. Historical presidential cycle analysis often shows the latter half of the second year and the third year as among the strongest periods for equities.
- Policy Compromise – Divided government (common after midterms) means gridlock and predictability, which often leads to more market-friendly outcomes.
Key Patterns from Historical Analyses
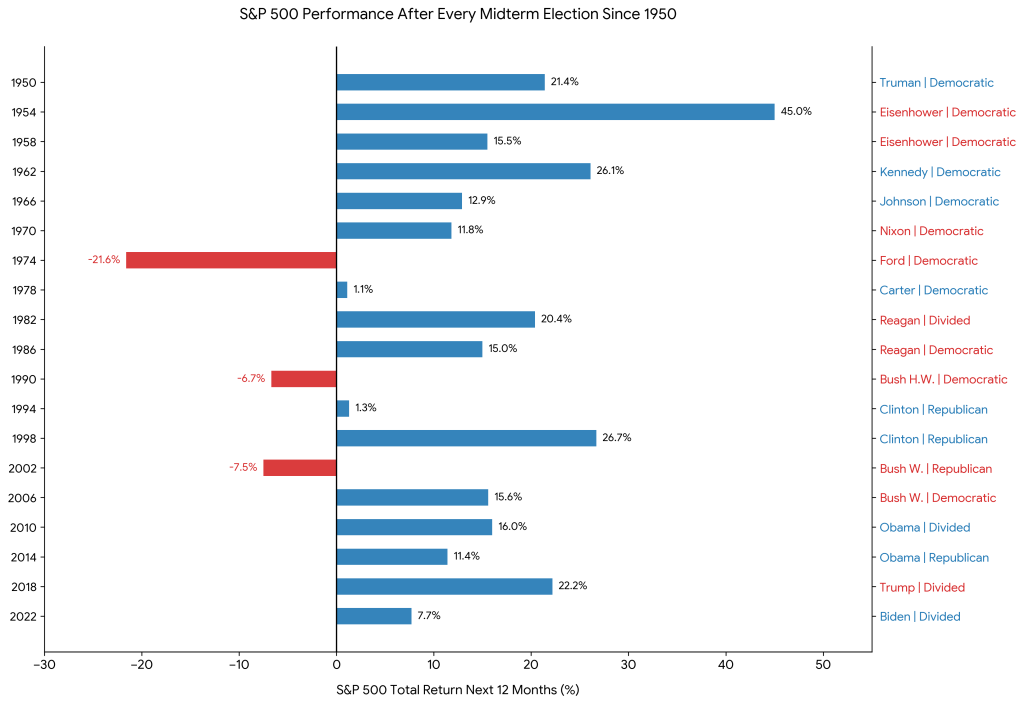
- Overall post-midterm strength is consistent: The S&P 500 has tended to perform well in the months and year after midterms regardless of the president’s party. This aligns with the resolution of uncertainty once voters decide congressional control. One-year average returns after midterms have often been in the 12–16% range since the 1950s, significantly stronger than the pre-midterm period.
- Research analysis (covering multiple cycles): A chart of one-year S&P 500 price returns after midterms shows positive performance in most cases, with red administrations representing Republican presidents, and blue administrations representing Democratic presidents, with both generally delivering gains. The chart emphasizes that markets respond more to reduced uncertainty and improving growth expectations than to the specific power-sharing arrangement in Washington.
- Split/Divided Government Context (common when the president’s party loses seats):
- Democratic president + Republican (or split) Congress has historically been one of the stronger combinations for equities in some studies.
- Republican president + Democratic Congress has sometimes shown more mixed or slightly below-average results in certain analyses, though still often positive overall.
- Broader data on government control (not limited to immediate post-midterm) shows divided government often correlates with solid returns (9.9%+ average annual S&P gains in some periods).
Examples and Nuances
- Democratic presidents facing losses (e.g., Obama 2010, Clinton 1994, Biden 2022): Markets frequently rallied post-election as gridlock set in, with examples like strong gains in 2011 and 2023 periods.
- Republican presidents facing losses (e.g., Bush 2006, Trump 2018): Also saw post-midterm recoveries in many cases, though influenced by broader events like the 2008 financial crisis.
- Short-term the pattern of stronger post-election performance holds, but party-specific differences are less pronounced or statistically noisy due to small sample sizes and confounding factors.
Important Caveats
- Small sample size and external factors dominate: With only a handful of relevant midterms per party, outliers (recessions, wars, pandemics) heavily influence averages. Party control alone doesn’t reliably predict returns.
- Divided governments are often favored by markets: Gridlock can limit significant policy changes, which some interpret as “do no harm” for business.
- Past performance doesn’t always equal future results: Always true, but especially relevant here. Long-term stock returns are driven far more by earnings, interest rates, innovation, and economic growth than by midterm outcomes.
What This Means for 2026 and Beyond
As investors look ahead to the next midterm cycle, historical patterns suggest reduced political uncertainty could provide a favorable environment for equities, particularly if combined with solid corporate earnings and a stable economic outlook.
Bottom line: The data supports a long-term optimistic bias for stocks in the months immediately following U.S. midterm elections. For investors, this reinforces the value of staying invested through the noise rather than trying to time volatile pre-election periods, as market timing has proven to be a long-term exercise in futility.
In summary, markets have historically fared well after midterms when the president’s party loses seats, with broadly similar (positive) tendencies whether the president is Democratic or Republican. Relief from uncertainty appears more important than partisan specifics.
About the Author
Joseph M. Favorito, CFP® is a Certified Financial Planner® as well as the founder and managing partner at Landmark Wealth Management, LLC, a fee-only SEC registered investment advisory firm. He specializes in helping individuals and families develop comprehensive financial strategies to achieve their long-term goals.