
Determining what portion of your investments are foreign vs domestic has become increasingly difficult in recent decades. Many large U.S. companies, particularly those in the S&P 500, rely significantly on international markets for their revenue streams. This global exposure helps diversify earnings beyond the domestic economy but also introduces risks from currency fluctuations, geopolitical events, and varying growth rates abroad.
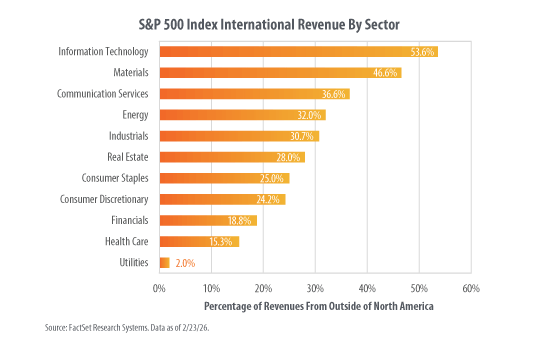
According to recent data from FactSet Research Systems illustrated above, the percentage of revenues derived from outside North America varies widely by sector in the S&P 500 Index. Information Technology leads with 53.6% of revenues coming from international sources (excluding North America), highlighting the sector’s heavy dependence on global demand for tech products and services. Materials follow at 46.6%, reflecting commodity-driven businesses with worldwide customer bases.
Other notable sectors include:
- Communication Services: 36.6%
- Energy: 32.0%
- Industrials: 30.7%
- Real Estate: 28.0%
- Consumer Staples: 25.0%
- Consumer Discretionary: 24.2%
- Financials: 18.8%
- Health Care: 15.3%
- Utilities: Just 2.0%, the lowest, as these companies tend to serve regulated, localized markets.
This sectoral breakdown underscores how certain industries, especially tech, materials, and energy are more intertwined with the global economy. Overall, recent analyses indicate that S&P 500 companies generate roughly 41% of their total revenues from abroad (outside the U.S.), though figures specifically excluding North America (as in the chart) are typically somewhat lower due to inclusion of Canadian revenues in domestic totals. This international tilt has been a tailwind in periods of strong global growth or a weaker U.S. dollar, with companies having higher overseas exposure often reporting stronger earnings growth in recent quarters.
Conversely, the picture flips when examining developed international markets outside North America, as captured by the MSCI EAFE Index (covering Europe, Australasia, and the Far East). Companies in this index derive a meaningful portion of their revenues from the United States.
Recent MSCI data (as of late 2025) shows that EAFE companies generate approximately 19-22% of their revenues from the U.S. (or North America more broadly, around 20-24% including Canada). For context:
- North America exposure for EAFE companies stands at roughly 20.7% in some estimates.
- The U.S. specifically accounts for about 19.2% in detailed revenue breakdowns.
This is notably higher than historical levels (around 15% in 2010), reflecting increased globalization and U.S. market importance as a consumer and tech powerhouse. In comparison, U.S. companies have much higher domestic concentration, with about 60-73% of revenues from the U.S. or North America.
This mutual exposure illustrates the interconnected nature of global markets. U.S. firms benefit from overseas demand, while international developed market companies increasingly tap into American consumers and innovation ecosystems. For investors, this dynamic supports the case for geographic diversification. Gains in one region can offset challenges in another, especially amid ongoing shifts like currency movements, trade policies, and varying economic cycles between the U.S. and the rest of the developed world.
When investors evaluate their international portfolio exposure, the answer is not necessarily as clear as simply examining which stocks, or mutual funds are international or domestic by where they are incorporated.
A more granular example is that of Toyota. In 2025 Toyota sold more than 2.5 million automobiles in the USA. In contrast, total sales in Japan were around 1.5 million automobiles. This was not an anomaly, but rather a pattern that has held over a period of many years.
In summary, while U.S. large-caps draw substantial revenue internationally (with tech and materials at the forefront), EAFE constituents rely on the U.S. for roughly one-fifth of their sales, creating a web of cross-border economic ties that influences both indices’ performance.
About the Author
Joseph M. Favorito, CFP® is a Certified Financial Planner® as well as the founder and managing partner at Landmark Wealth Management, LLC, a fee-only SEC registered investment advisory firm. He specializes in helping individuals and families develop comprehensive financial strategies to achieve their long-term goals.