
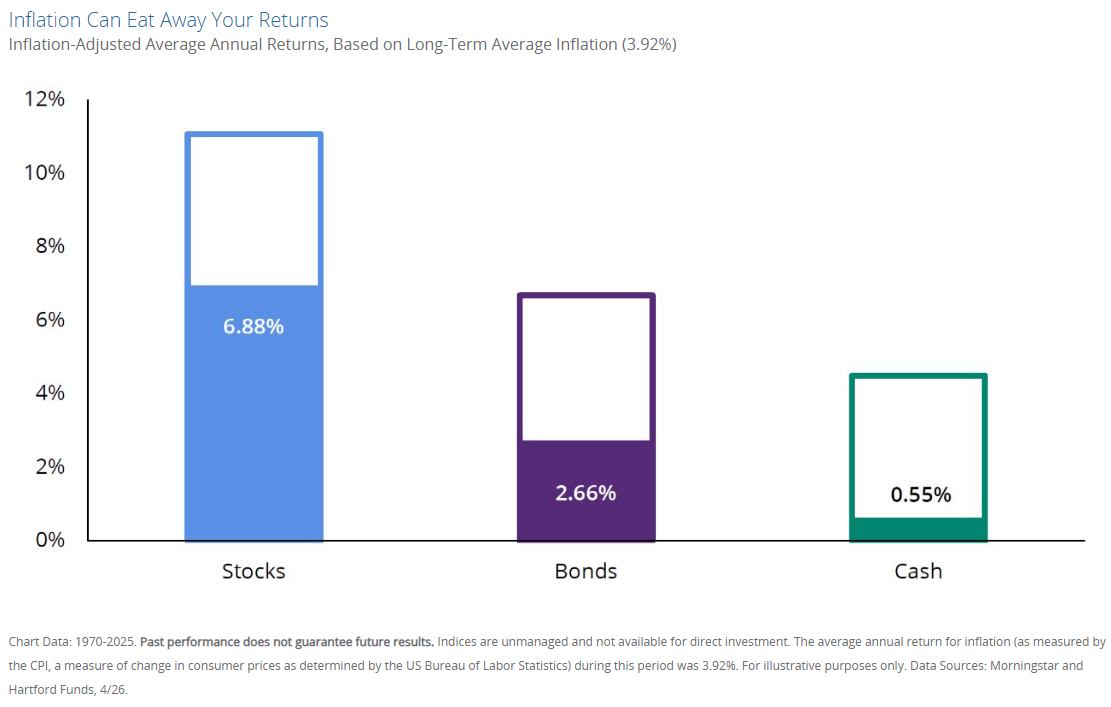
Inflation is often called the silent thief of purchasing power. Even modest annual increases in the cost-of-living compound over decades and can leave investors with less real wealth than the headline numbers suggest. A clear illustration of this effect appears in long-term data on inflation-adjusted average annual returns for stocks, bonds, and cash.
According to data compiled by Morningstar and Hartford covering 1970–2025, the average annual inflation rate (measured by the Consumer Price Index) during this period was 3.92%. After subtracting that inflation, the approximate real (inflation-adjusted) average annual returns were:
- Stocks: 6.88%
- Bonds: 2.66%
- Cash: 0.55%
The chart visualizes these real returns as the solid-colored portions of each bar, with the open upper sections representing the portion of nominal returns that inflation consumed. The message is straightforward: over multi-decade periods, equities have historically delivered meaningfully higher real growth than bonds or cash, while cash has barely kept pace with rising prices.
Why the 1970s Stand Out
It is important to note that the 1970–2025 period includes an unusually high-inflation decade. The 1970s experienced average annual inflation around 7%, driven by oil shocks, loose monetary policy, and the end of the Bretton Woods system. Peak years saw double-digit readings (for example, 1974, 1979, and 1980). This elevated decade pulls the average inflation rate for the full 1970–2025 span higher than the roughly 3.2–3.3% long-term average observed over the past century of U.S. CPI data (since 1913).
In other words, the 3.92% inflation figure used in the chart is higher than the 100-year historical norm because of that one high-inflation decade. Real returns calculated over a longer century-long window would generally look somewhat more favorable for all asset classes (especially cash and bonds) simply because average inflation would be lower. The 1970–2025 data still remain highly relevant, however, because they capture a modern era that includes multiple market regimes: the high-inflation 1970s, the disinflationary bull markets of the 1980s–1990s, the tech bubble and Global Financial Crisis, the post-2008 low-rate environment, and the post-pandemic inflation spike.
What the Numbers Mean for Investors
Stocks have historically been the most effective long-term tool for growing purchasing power. The roughly 6.9% real annual return compounds powerfully. Over multi-decade horizons, equity ownership has more than offset inflation and generated substantial real wealth for patient investors. Of course, stocks come with higher short-term volatility; the path includes sharp drawdowns.
Bonds have provided a more moderate real return (about 2.7%). They have generally outpaced inflation while offering lower volatility and income. In a diversified portfolio they often serve as a stabilizer rather than the primary growth engine.
Cash (and cash-like instruments) has delivered only a thin real return of about 0.55% per year on average. While essential for liquidity, emergency reserves, and short-term needs, holding large amounts of cash for long periods has historically been a reliable way to lose purchasing power slowly but steadily.
These relationships are not guarantees of future results. Still, the broad pattern has been consistent across many long periods: equities have been the primary engine of real wealth creation, while cash has lagged.
Practical Takeaways
- Match time horizon to asset allocation. Money needed in the next few years belongs primarily in high-quality short-term instruments. Money that will not be needed for a decade or longer has historically benefited from a meaningful equity allocation.
- Focus on real, not nominal, returns. A 5% nominal return in a 4% inflation environment is far less valuable than the same nominal return in a 2% inflation environment.
- Diversification still matters. Stocks, bonds, and cash play complementary roles. The optimal mix depends on an investor’s goals, risk tolerance, tax situation, and time horizon.
- Context is essential. The elevated inflation of the 1970s is a reminder that inflation regimes can shift, as it briefly did from 2021-2022 after 20-years of near 2% annual inflation. Investors should periodically reassess whether their portfolio is positioned to protect purchasing power under a range of possible future inflation paths.
Understanding how inflation interacts with different asset classes is one of the foundational elements of long-term financial planning. The historical record from 1970–2025 underscores a simple but powerful point: over extended periods, equities have been the asset class most capable of delivering returns that meaningfully outpace the rising cost of living. With that comes increased volatility, which is the price you must pay to outpace inflation.
About the Author
Joseph M. Favorito, CFP® is a Certified Financial Planner® as well as the founder and managing partner at Landmark Wealth Management, LLC, a fee-only SEC registered investment advisory firm. He specializes in helping individuals and families develop comprehensive financial strategies to achieve their long-term goals.