
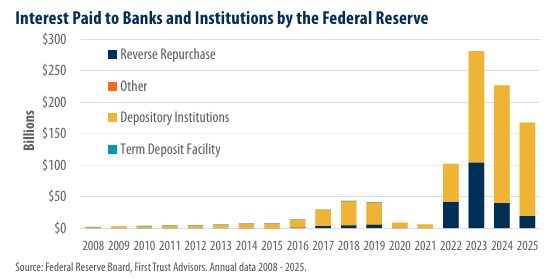
The Federal Reserve has quietly become one of the largest payers of interest in the U.S. financial system. The chart above compiled by First Trust sourced via the Federal Reserve shows annual interest paid to banks and institutions by the Federal Reserve surging from near-zero levels before 2021 to nearly $300 billion at its 2023 peak and remaining elevated through 2025.
This isn’t pocket change. It represents one of the largest ongoing transfers from the public sector to private banks and financial institutions in history. Here’s what the data shows, why it happened, and why these massive payments are raising serious concerns about fiscal costs, taxpayer impact, and monetary policy distortions.
What the Chart Shows (2008–2025)
The bar chart tracks four categories of Federal Reserve interest payments (in billions of dollars):
- Depository Institutions (yellow) – primarily interest on reserve balances (IORB) paid to commercial banks.
- Reverse Repurchase Agreements (dark blue) – interest paid on the overnight reverse repo (ON RRP) facility, mostly to money market funds and other non-bank institutions.
- Other (orange) and Term Deposit Facility (teal) – minor categories that barely register.
Key trends from the chart:
- 2008–2021: Payments were negligible, typically under $50 billion per year. Rates were near zero and the Fed’s balance sheet, while growing after 2008 and especially during COVID QE, didn’t cost much to “fund.”
- 2022: Payments jumped sharply past $100 billion as the Fed hiked rates aggressively.
- 2023: Record high, approaching $300 billion. This was the peak year, driven by both high policy rates (5.25–5.50%) and still-elevated reserve levels from quantitative easing.
- 2024: Declined to roughly $220 billion.
- 2025: Further drop to about $160 billion, but still far above any pre-2022 level.
The overwhelming majority of the recent surge went to depository institutions (banks), with reverse repurchase agreements adding a significant secondary spike in 2022–2023 when the ON RRP facility ballooned to over $2 trillion.
Why the Federal Reserve Started Paying Banks Hundreds of Billions
This isn’t an accident, it’s the direct result of post-2008 monetary policy design:
- Quantitative Easing flooded the system with reserves. The Fed’s balance sheet expanded from under $1 trillion pre-2008 to nearly $9 trillion at peak. Banks and money funds ended up holding trillions in excess reserves at the Fed.
- The “ample reserves” framework requires the Fed to pay interest on those reserves (IORB) to maintain control over short-term interest rates. Without it, banks could lend reserves to each other at rates below the Fed’s target.
- 2022 rate hikes pushed the IORB rate from near zero to over 5%. With trillions in reserves still sitting there, the interest expense exploded.
The reverse repo leg served a similar purpose: money market funds parked cash overnight at the Fed instead of lending it elsewhere, earning the ON RRP rate and helping set a floor under money-market rates.
Why These Large Transfers to the Banking System Are a Problem
While the mechanism is technically necessary for rate control, the scale of the transfers has created real-world issues that go far beyond textbook monetary policy:
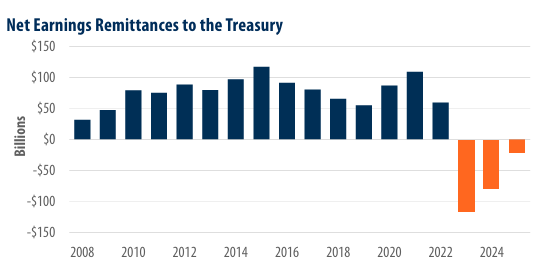
- Massive fiscal cost to taxpayers – For decades, the Fed earned profits on its bond portfolio and remitted them to the U.S. Treasury (roughly $100 billion per year at peak). Since 2022, those remittances have stopped. The Fed is now running operating losses, with cumulative negative earnings exceeding $200 billion. The chart below demonstrates how these remittances have reversed. Those annual losses sit as a “deferred asset” on the Fed’s balance sheet, meaning future profits will repay the losses before any money returns to the Treasury. In effect, the government (and ultimately taxpayers) is subsidizing the interest payments banks receive.
- Wealth transfer from Main Street to Wall Street – Banks and large financial institutions receive risk-free, high yield returns on reserves that were created out of thin air during QE. Meanwhile, households and small businesses pay elevated mortgage, credit-card, and loan rates. Critics rightly call this a form of “corporate welfare”, especially since the largest banks hold the biggest reserve balances and capture the lion’s share.
- Distorted incentives and moral hazard – Paying banks higher yields on reserves encourages them to hold excess liquidity at the Fed rather than lending it into the real economy. While the policy prevents rates from collapsing, it also props up bank profitability without requiring credit creation or economic risk-taking. The reverse repo boom similarly rewarded money market funds for parking cash instead of investing.
- Highlights the long-term cost of QE – The chart is visual proof that ultra-loose balance-sheet policy isn’t free. When rates eventually normalize, the interest expense on a $7+ trillion balance sheet becomes a permanent drag. Even as quantitative tightening (QT) slowly reduces reserves and the ON RRP facility drains (explaining the 2024–2025 decline), the annual bill remains in the $150–200 billion range, larger than the budget of many federal departments.
- Broader economic and political implications – In an era of $36 trillion national debt and high deficit spending, transferring hundreds of billions annually to the banking system fuels public distrust. It adds indirect pressure on federal borrowing costs and complicates the narrative that the Fed is an independent, apolitical institution.
The Bottom Line: Payments Are Falling: But the Issues Remain
The 2025 decline shown in the chart is positive and reflects successful quantitative tightening. As reserves shrink and the ON RRP facility continues to drain, Fed interest payments should moderate further in 2026 and beyond.
Yet, the episode underscores a fundamental tension: modern monetary policy relies on paying the banking system enormous sums to manage the consequences of its own prior actions. Whether you view it as a necessary cost of stability or an unacceptable subsidy, the numbers don’t lie. The Federal Reserve’s interest payments to banks have become a multi-hundred-billion-dollar annual feature of the U.S. financial system.
For investors, advisors, and policymakers, the chart is a reminder to watch the Fed’s balance sheet, reserve levels, and quarterly remittances closely. The era of “free” quantitative easing is over, and the bill is still arriving in the mail.
About the Author
Joseph M. Favorito, CFP® is a Certified Financial Planner® as well as the founder and managing partner at Landmark Wealth Management, LLC, a fee-only SEC registered investment advisory firm. He specializes in helping individuals and families develop comprehensive financial strategies to achieve their long-term goals.