
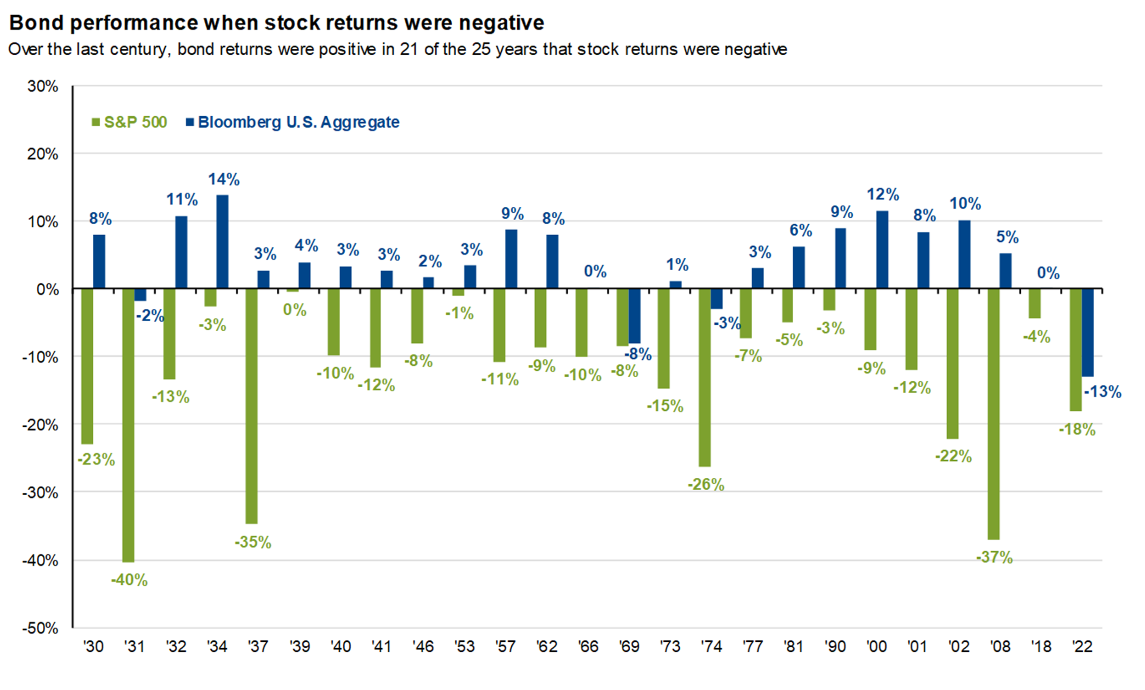
Over the last 100 years, U.S. stocks have delivered strong long-term returns. Yet they have not gone up every year. In the 25 calendar years since 1930 when the S&P 500 finished lower, bonds (as measured by the Bloomberg U.S. Aggregate Bond Index or its historical predecessors) produced positive returns in 21 of those years. That simple historical fact remains one of the strongest arguments for holding a diversified mix of stocks and bonds.
The Record at a Glance
The chart (courtesy of JP Morgan) of those 25 down years for stocks reveals a clear pattern. In the majority of cases, intermediate-term investment-grade bonds delivered positive total returns while equities declined. Notable examples include:
- 1930: Stocks −23%, bonds +8%
- 1932: Stocks −13%, bonds +11%
- 1937: Stocks −35%, bonds +3%
- 1957: Stocks −11%, bonds +9%
- 1962: Stocks −9%, bonds +8%
- 2000–2002 (the tech-bubble bear market): Stocks fell −9%, −12%, and −22%; bonds returned +12%, +8%, and +10%
- 2008: Stocks −37%, bonds +5%
There were only four years in which both stocks and bonds finished negative: 1931 (−40% stocks / −2% bonds), 1969 (−8% / −8%), 1974 (−26% / −3%), and 2022 (−18% / −13%). Even in those rare dual-loss years, the bond declines were usually modest relative to the equity losses.
Why Bonds Have Often Helped
Several structural reasons explain the historical pattern:
- Interest-rate response in slowdowns
Equity bear markets frequently coincide with economic weakness or recession. In those environments the Federal Reserve has often cut rates or investors have anticipated lower future rates. Falling yields raise bond prices, generating capital gains that offset or exceed coupon income. - Flight-to-quality flows
During sharp equity sell-offs, investors typically move capital into U.S. Treasuries and high-quality corporate bonds. The resulting demand supports bond prices even when credit spreads widen modestly. - Income cushion
Bonds generate contractual cash flow. That income continues regardless of price volatility and has historically provided a floor under total returns in many negative equity years. - Lower long-term volatility
The Bloomberg U.S. Aggregate has exhibited roughly one-third to one-half the annualized volatility of the S&P 500 over multi-decade periods. Lower volatility means smaller drawdowns on average.
Important Caveats Investors Should Understand
The historical edge is real, but it is not a guarantee:
- Rising-rate environments can hurt both asset classes. 2022 illustrated this clearly. Aggressive Federal Reserve rate hikes to combat inflation produced simultaneous losses in stocks and bonds, the first calendar year of dual negative returns since 1969.
- Credit risk and duration matter. The Aggregate Index is investment-grade and intermediate in maturity. High-yield bonds or long-duration Treasuries can behave differently (sometimes better, sometimes worse) in equity downturns.
- Inflationary regimes change correlations. Periods of persistent high inflation have occasionally produced positive correlations between stocks and bonds. The post-2021 experience is a recent reminder.
- Starting valuations and policy regimes evolve. Past performance does not guarantee future results. The interest-rate environment of the 2020s is different from the 1930s or the 1980s–2010s.
Practical Implications for Portfolio Construction
For long-term investors the data support several actionable principles:
- Maintain a strategic bond allocation. A permanent allocation to high-quality intermediate bonds has historically reduced the depth and length of portfolio drawdowns without eliminating long-term equity participation.
- Match duration and credit quality to time horizon and risk tolerance. Investors with shorter horizons or lower risk capacity generally benefit from shorter-duration, higher-quality fixed income. Those with longer horizons can accept modest credit or duration risk for higher expected yield.
- Rebalance. When stocks fall sharply and bonds rise (or fall less), disciplined rebalancing automatically buys equities at lower prices and trims bonds at higher prices, the opposite of emotional selling.
- Consider the full opportunity set. While the Aggregate Index is a useful benchmark, many investors today also hold a more diversified set of fixed income holdings to adapt to differing environments.
Bottom Line
A century of market history shows that high-quality U.S. bonds have delivered positive returns in the large majority of years when stocks declined. That pattern is one reason diversified stock-and-bond portfolios have historically recovered from equity bear markets faster than equity-only portfolios.
The relationship is not perfect, as 2022 proved that, and future correlations can shift with inflation, monetary policy, and fiscal dynamics. Still, the long-term evidence remains persuasive: bonds have often acted as a useful counterweight when stocks struggle. For investors seeking to stay invested through full market cycles, that historical ballast continues to matter.
About the Author
Joseph M. Favorito, CFP® is a Certified Financial Planner® as well as the founder and managing partner at Landmark Wealth Management, LLC, a fee-only SEC registered investment advisory firm. He specializes in helping individuals and families develop comprehensive financial strategies to achieve their long-term goals.