
The unemployment rate is one of the most closely watched economic indicators, influencing Federal Reserve policy, investment decisions, and political debates. When you hear “the unemployment rate fell to 4.3%,” that usually refers to the U-3 rate. But this official figure doesn’t tell the full story of labor market health. The Bureau of Labor Statistics (BLS) publishes a range of alternative measures, U-1 through U-6, that provide a more nuanced view of unemployment and underutilization.
What Is the Official Unemployment Rate (U-3)?
U-3 is the headline unemployment rate reported monthly in the BLS Employment Situation release. It measures the number of people who are unemployed and actively looking for work in the past four weeks, expressed as a percentage of the civilian labor force (people who are either working or actively seeking work).
How it’s measured:
- Unemployed: Jobless, available for work, and have actively searched for a job in the last 4 weeks (e.g., sending resumes, interviewing, contacting employers).
- Formula: (Total Unemployed ÷ Civilian Labor Force) × 100.
- As of recent data (around April 2026), U-3 stood near 4.3%.
U-3 is the standard international measure and the one most cited by media and policymakers. However, it excludes people who have given up looking, or are working fewer hours than desired.
Broader Measures: U-4, U-5, and U-6
The BLS provides progressively broader gauges of labor underutilization:
- U-4: U-3 + discouraged workers. Discouraged workers want a job, are available, have looked for work in the past 12 months, but stopped actively searching in the last 4 weeks because they believe no jobs are available for them. Denominator adjusts to include discouraged workers. Recent levels have been around 4.6%.
- U-5: U-4 + other marginally attached workers. Marginally attached individuals want and are available for work, have looked in the past 12 months, but not in the last 4 weeks, for reasons other than discouragement (e.g., family responsibilities, transportation issues). This captures a wider group of people loosely connected to the labor force. Recent figures hover near 5.3%.
- U-6: The broadest and most comprehensive measure. U-5 + people employed part time for economic reasons (involuntary part-time workers). These are individuals working fewer hours than they want because they can’t find full-time work or their hours were cut due to slack business conditions. Formula roughly: (Unemployed + Marginally Attached + Involuntary Part-Time) ÷ (Labor Force + Marginally Attached) × 100. U-6 often runs 3–5 percentage points higher than U-3 and was recently around 8.2%.
U-6 is widely regarded as a better indicator of overall labor market slack, especially during recoveries when underemployment persists.
Why These Differences Matter
- U-3 can understate problems when many workers drop out of the labor force or settle for part-time roles.
- U-6 gives a fuller picture of economic pain, including “hidden unemployment.”
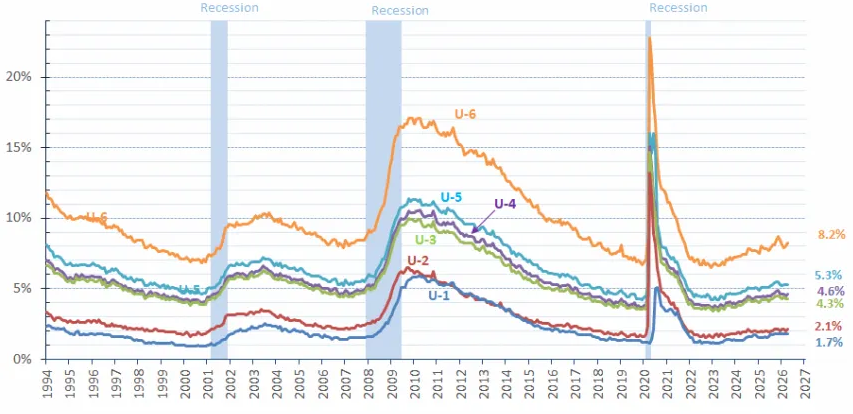
- During the Great Recession, U-3 peaked near 10%, while U-6 exceeded 17%. In the COVID-19 shock of 2020, both spiked dramatically, with U-6 reaching over 20% at one point.
These measures help investors, economists, and policymakers assess whether the economy is truly at full employment or if there is still slack that could keep inflation in check or warrant stimulus.
Historical Trends: U-3 vs. U-6
Here is a historical overview (approximate annual/period values for illustration; actual monthly data shows more volatility):
The chart above (generated from historical patterns) highlights how U-6 consistently exceeds U-3, with the gap widening during downturns as underemployment and discouragement rise. Post-recession recoveries often see U-3 improve faster than U-6.
Key Takeaways for Investors and Analysts
- Watch the spread between U-3 and U-6. A widening gap can signal weakening labor conditions even if the headline rate looks stable.
- Context is everything: Low U-3 with high U-6 may indicate a bifurcated market (strong for some, weak for others).
- Policy implications: The Fed considers broader measures when setting interest rates.
- Monthly updates: Check the BLS Table A-15 for the latest alternative measures, released with the jobs report.
Understanding U-3 through U-6 moves you beyond headlines to a deeper grasp of the economy’s true health. Whether you’re evaluating stocks, bonds, or your own career prospects, these metrics offer critical context in an ever-changing labor market.
Data sources primarily include the U.S. Bureau of Labor Statistics and FRED.
About the Author
Joseph M. Favorito, CFP® is a Certified Financial Planner® as well as the founder and managing partner at Landmark Wealth Management, LLC, a fee-only SEC registered investment advisory firm. He specializes in helping individuals and families develop comprehensive financial strategies to achieve their long-term goals.