
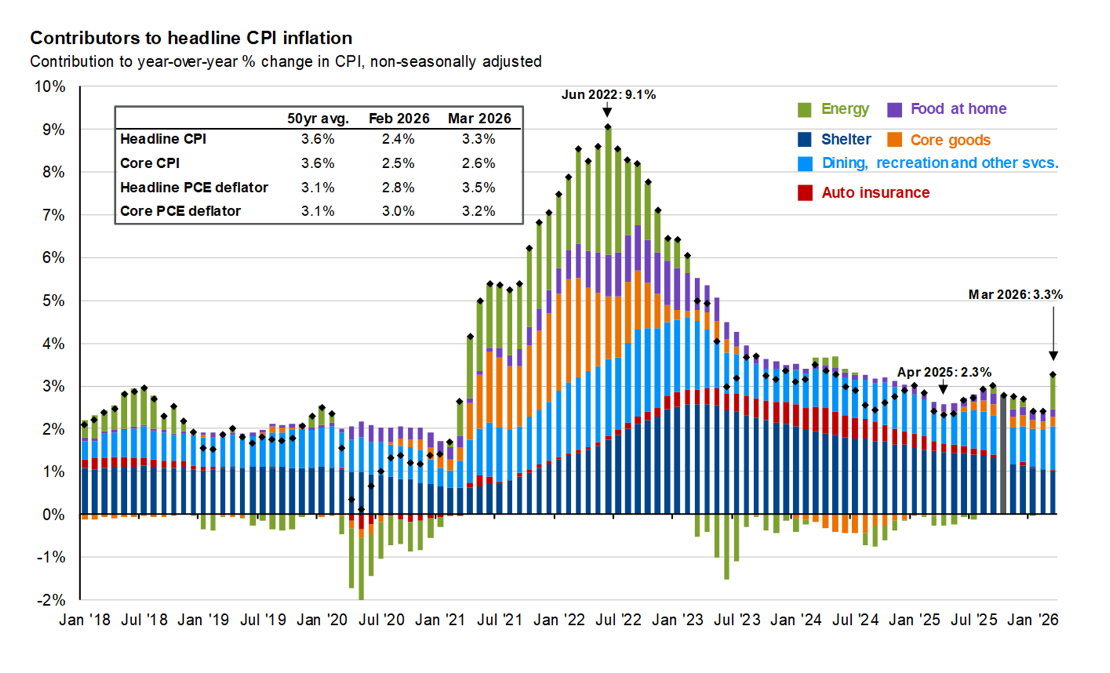
U.S. inflation has stabilized significantly since the 2022 peak, but as of March 2026, headline CPI stands at 3.3% year-over-year, slightly below the 50-year average of 3.6% shown in recent analyses. Core CPI (excluding food and energy) sits at a more moderate 2.6%.
A detailed stacked contribution chart of year-over-year CPI changes reveals exactly which categories are driving or offsetting price pressures. Understanding these contributors to headline CPI inflation provides crucial insight for consumers, investors, and policymakers.
What the Latest CPI Contribution Chart Reveals (2018–March 2026)
The visualization breaks down inflation into key buckets:
- Shelter (largest persistent driver in the last few years)
- Energy (highly volatile)
- Food at home
- Dining, recreation & other services
- Core goods
- Auto insurance
Key observations from the data:
- Inflation surged to a peak of 9.1% in June 2022, fueled by broad increases across energy, food, goods, and services in the aftermath of a massive money supply expansion.
- Shelter (primarily rent and owners’ equivalent rent) has been the most “sticky” component, contributing heavily through 2023–2025 and remaining a dominant positive contributor into 2026.
- Energy swung wildly: major upside driver in 2021–2022, deeply negative (deflationary) at times in 2020 and 2022–2023 and showing renewed volatility recently.
- Core goods helped push inflation higher during supply chain disruptions but later provided relief through price declines (negative contributions).
- Auto insurance emerged as a noticeable new pressure point in recent years.
- By early 2026, the overall mix has moderated, with services and shelter still elevated while goods and energy offer some counterbalance.
Headline PCE and Core PCE (the Fed’s preferred measures) have generally run a bit lower than CPI, reflecting different methodologies and weightings.
How 2020s Inflation Compares to Past Decades
The post-pandemic inflation spike was notable but pales in comparison to historical episodes:
- 1970s: The worst decade for U.S. inflation in modern history. Annual rates frequently exceeded 10%, peaking near 13–14% in 1980. Oil shocks, wage-price spirals, and loose monetary policy created stagflation. Cumulative inflation for the decade topped 100% in some measures.
- 1980s: Inflation was tamed through aggressive Federal Reserve rate hikes under Paul Volcker. Rates started high (double digits early in the decade) but fell sharply. Average around 5–6%.
- 1990s–2010s: The “Great Moderation.” Annual CPI inflation averaged roughly 2–3%, with exceptional stability. The 2010s were particularly tame, often below 2% annually, aided by globalization and technology.
Inflation Across the Decades
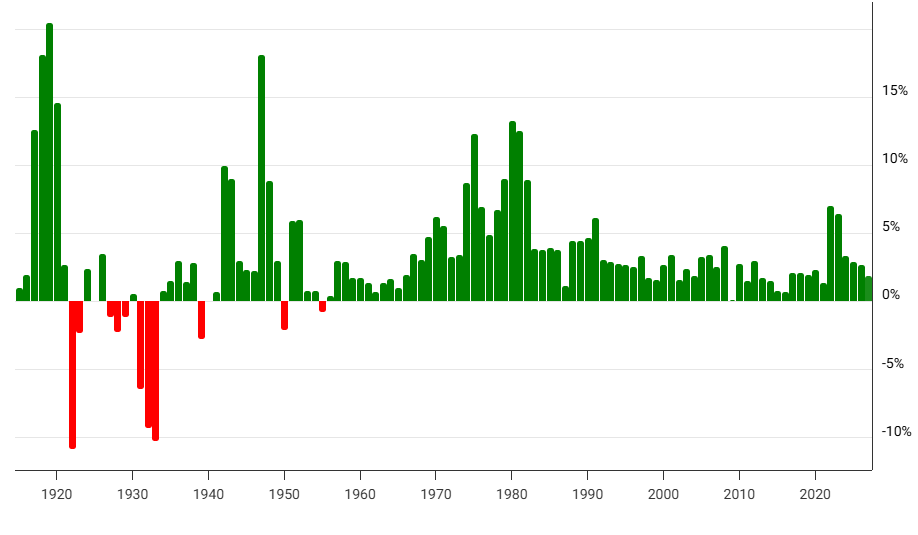
2020s Context: The 2021–2022 surge (peaking at about 9%) was the highest in 40 years, driven by pandemic supply shocks, energy market disruptions, and most importantly a 40% increase in the M2 money supply over a short period of time. However, the disinflation since mid-2022 has been relatively swift compared to the 1970s and early 1980s, thanks in part to aggressive Fed tightening and normalizing supply chains.
As of March 2026, the 3.3% headline reading sits near the long-term average but remains above the Fed’s 2% target. Unlike the 1970s, today’s pressures are more concentrated in shelter and services rather than a broad wage-price spiral, though energy volatility (exacerbated by recent geopolitical events) can quickly shift the headline number.
Why This Matters for Consumers and the Economy
- Housing costs (shelter) continue to weigh on household budgets more than in the low-inflation 2010s.
- Goods deflation in categories like core goods has provided some relief at the store.
- Services inflation (dining, recreation, insurance) reflects a services-heavy recovery and labor market dynamics.
Implications:
- For the Federal Reserve: Sticky shelter/services suggest caution on rate cuts, while energy swings complicate policy.
- For households: Real wage growth depends on whether pay increases outpace the remaining 2.5–3.5% inflation environment.
- For investors: Sector performance often diverges based on which CPI components are rising (e.g., energy stocks vs. rate-sensitive assets).
The Path Forward
Inflation has cooled substantially from its 2022 highs, but returning sustainably to 2% will likely require further moderation in shelter costs and contained services prices. The detailed category breakdown in the contribution chart is more informative than the headline number alone, as it shows both progress and remaining challenges.
Data sources: U.S. Bureau of Labor Statistics. Historical comparisons drawn from long-term CPI records.
About the Author
Joseph M. Favorito, CFP® is a Certified Financial Planner® as well as the founder and managing partner at Landmark Wealth Management, LLC, a fee-only SEC registered investment advisory firm. He specializes in helping individuals and families develop comprehensive financial strategies to achieve their long-term goals.