
Big stock market drops grab headlines, spark panic, and test even the most seasoned investors. Yet history shows that the worst single-day declines in the S&P 500 often precede some of the strongest rebounds. This analysis of the 10 worst S&P 500 one-day declines from 1981 to 2025 highlights not just the pain of the crash, but the remarkable recovery patterns that followed.
The Biggest One-Day Drops in S&P 500 History
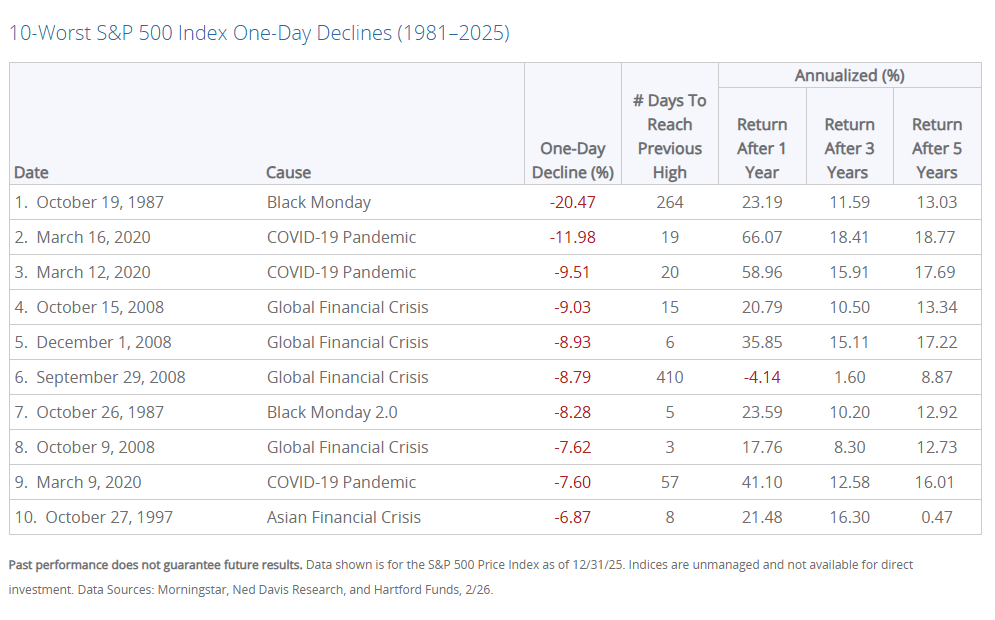
Here are the 10 largest single-day percentage declines in the S&P 500 over the 45-year period, ranked by severity:
- October 19, 1987 – Black Monday
- One-Day Decline: -20.47%
- Days to Recover Previous High: 264
- 1-Year Return After: +23.19%
- 3-Year Return: +11.59%
- 5-Year Return: +13.03%
- March 16, 2020 – COVID-19 Pandemic
- One-Day Decline: -11.98%
- Days to Recover: 19
- 1-Year Return: +66.07%
- 3-Year Return: +18.41%
- 5-Year Return: +18.77%
- March 12, 2020 – COVID-19 Pandemic
- One-Day Decline: -9.51%
- Days to Recover: 20
- 1-Year Return: +58.96%
- 3-Year Return: +15.91%
- 5-Year Return: +17.69%
- October 15, 2008 – Global Financial Crisis
- One-Day Decline: -9.03%
- Days to Recover: 15
- 1-Year Return: +20.79%
- 3-Year Return: +10.50%
- 5-Year Return: +13.34%
- December 1, 2008 – Global Financial Crisis
- One-Day Decline: -8.93%
- Days to Recover: 6
- 1-Year Return: +35.85%
- 3-Year Return: +15.11%
- 5-Year Return: +17.22%
- September 29, 2008 – Global Financial Crisis
- One-Day Decline: -8.79%
- Days to Recover: 410
- 1-Year Return: -4.14%
- 3-Year Return: +1.60%
- 5-Year Return: +8.87%
- October 26, 1987 – Black Monday 2.0
- One-Day Decline: -8.28%
- Days to Recover: 5
- 1-Year Return: +23.59%
- 3-Year Return: +10.20%
- 5-Year Return: +12.92%
- October 9, 2008 – Global Financial Crisis
- One-Day Decline: -7.62%
- Days to Recover: 3
- 1-Year Return: +17.76%
- 3-Year Return: +8.30%
- 5-Year Return: +12.73%
- March 9, 2020 – COVID-19 Pandemic
- One-Day Decline: -7.60%
- Days to Recover: 57
- 1-Year Return: +41.10%
- 3-Year Return: +12.58%
- 5-Year Return: +16.01%
- October 27, 1997 – Asian Financial Crisis
- One-Day Decline: -6.87%
- Days to Recover: 8
- 1-Year Return: +21.48%
- 3-Year Return: +16.30%
- 5-Year Return: +0.47%
Key Takeaways from the Worst S&P 500 Declines
- Crashes Happen, But Recoveries Are Often Swift The average time to reach a new previous high across these 10 events was roughly 80 days, but many recovered in under a month. The 2008 Global Financial Crisis stands out with both the quickest bounce (just 3 days in one case) and the longest (410 days for September 29, 2008). The COVID-19 drops in March 2020 recovered in just 19–57 days, fueled by massive fiscal and monetary stimulus.
- Strong Long-Term Returns After Big Drops Despite the initial shock, most of these worst days were followed by robust rebounds:
- 1-year annualized returns were positive in 9 out of 10 cases, with several exceeding +20% and the 2020 COVID drops delivering +41% to +66%.
- 3-year and 5-year returns were overwhelmingly positive, often in the 10–18% annualized range.
- The lone negative 1-year return (September 29, 2008) still turned positive over longer horizons.
- Causes Cluster Around Major Crises The biggest drops were concentrated in three major events:
- Global Financial Crisis (2008) – 4 of the top 10
- COVID-19 Pandemic (2020) – 3 of the top 10
- Black Monday era (1987) – 2 of the top 10
This pattern underscores how systemic shocks, whether financial, health-related, or liquidity-driven, can trigger extreme volatility.
What This Means for Investors
Market crashes are painful in the moment, but the data clearly shows that staying invested through the worst S&P 500 one-day declines has historically been rewarded. The fastest recoveries often followed periods of extreme fear, when central banks and governments stepped in with support.
Key lessons:
- Time in the market beats timing the market. Trying to sell at the bottom and re-enter perfectly is extremely difficult.
- Volatility creates opportunity. Big declines can offer attractive entry points for long-term investors.
- Diversification and a long-term horizon matter. Even the slowest recovery in this list eventually delivered positive 5-year returns.
While no two crises are identical, the historical pattern of sharp drops followed by strong recoveries provides perspective during turbulent times. Investors facing the next big S&P 500 decline would do well to remember: the market has a habit of climbing the wall of worry.
About the Author
Joseph M. Favorito, CFP® is a Certified Financial Planner® as well as the founder and managing partner at Landmark Wealth Management, LLC, a fee-only SEC registered investment advisory firm. He specializes in helping individuals and families develop comprehensive financial strategies to achieve their long-term goals.