
Investing in the stock market can feel like a rollercoaster ride, with dramatic ups and downs that test even the most patient investors. Yet, a closer look at the S&P 500 Index performance over the past 100 years reveals a powerful truth: the market has delivered positive returns in the vast majority of years, rewarding those who stay invested for the long haul.
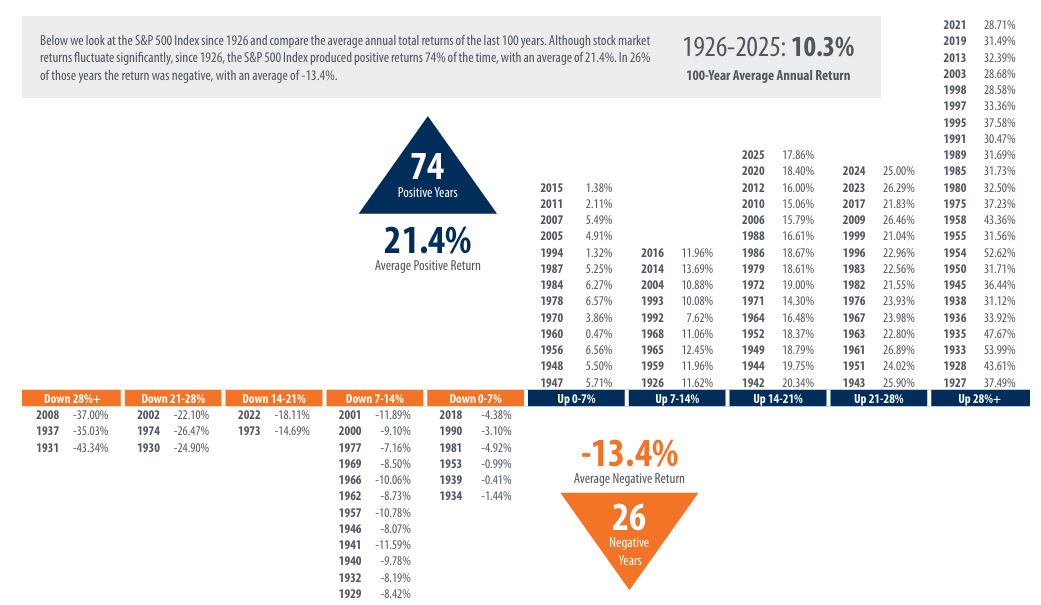
According to the data curtest of Bloomberg and Morningstar spanning 1926 to 2025, the S&P 500 produced positive annual total returns 74% of the time, with an average positive return of 21.4%. In the remaining 26% of years when returns turned negative, the average loss was a more manageable -13.4%. Over the full century, the index delivered an impressive 10.3% average annual return.
This historical perspective is crucial for anyone considering stock market investments, whether you’re a seasoned investor or just starting out.
Breaking Down the S&P 500’s 100-Year Performance
The chart categorizes S&P 500 annual returns into clear performance buckets, making it easy to visualize the distribution of gains and losses:
Positive Return Years (74 out of 100)
- Up 28%+: Exceptional years with massive gains
- Up 21-28%: Strong bull market performance
- Up 14-21%: Solid double-digit returns
- Up 7-14%: Consistent, healthy growth
- Up 0-7%: Modest but still positive years
The standout statistic here is the average positive return of 21.4% across those 74 winning years. Recent strong performers include 2021 (28.71%), 2019 (31.49%), and 2023 (26.29%), showing that big up years continue to occur even in modern markets.
Negative Return Years (26 out of 100)
- Down 28%+: Severe bear markets
- Down 21-28%: Significant corrections
- Down 14-21%: Notable declines
- Down 7-14%: Moderate losses
- Down 0-7%: Mild pullbacks
Even in down years, the average negative return of -13.4% is far less severe than the gains in positive years. The most extreme losses, such as -43.34% in 1931 during the Great Depression, stand out as rare events rather than the norm.
The Math Behind Long-Term Stock Market Success
The asymmetry between gains and losses is what drives the S&P 500’s strong long-term performance. When positive years outnumber negative ones nearly 3-to-1, and the average gain significantly exceeds the average loss, compounding works powerfully in investors’ favor.
Key takeaway: A 21.4% gain more than offsets a 13.4% loss. Over 100 years, this dynamic has produced that 10.3% average annual return, a figure that has helped build wealth for generations of investors who avoided panic selling during downturns.
Recent decades continue this pattern:
- Strong years like 2024 (25.00%) and 2025 (17.86%) show the market’s resilience.
- Even during challenging periods, the overall trajectory remains upward.
Why This Data Matters for Today’s Investors
In an era of economic uncertainty, inflation concerns, and geopolitical tensions, it’s easy to focus on short-term volatility. However, this 100-year S&P 500 chart reminds us that:
- Time in the market beats timing the market: Missing the best performing years can dramatically reduce overall returns.
- Down years are normal but temporary: With only 26 negative years in a century, bear markets have historically been followed by recoveries.
- Diversification through broad indices works: The S&P 500 represents 500 of America’s largest companies, providing built-in diversification.
For retirement savers, 401(k) participants, or anyone building long-term wealth, this data supports a disciplined, buy-and-hold strategy rather than reactive trading.
Lessons for Building Wealth in the Stock Market
The historical S&P 500 returns demonstrate several timeless investing principles:
- Stay invested through volatility: The 74% positive year rate means most years reward patience.
- Expect and prepare for downturns: Knowing that 26% of years will be negative helps mentally prepare investors to avoid emotional decisions.
- Focus on the long term: The 10.3% average annual return compounds impressively over decades.
- Avoid trying to predict or time: Even professional investors struggle to consistently avoid down years.
Whether you’re reviewing your portfolio allocation, considering index fund investments, or simply educating yourself about market history, this chart provides clear evidence that the U.S. stock market has been a reliable wealth-building vehicle over the very long term.
Final Thoughts on S&P 500 Historical Returns
The data from 1926-2025 paints a clear picture: while the stock market experiences significant fluctuations, the overall trend has been strongly positive. With positive returns in three out of every four years and an average annual return of 10.3%, the S&P 500 continues to demonstrate why equity investing still remains a cornerstone of long-term financial planning.
When investors are willing to weather occasional storms, the rewards have historically been substantial. As always, consider your personal risk tolerance, investment timeline, and consult with a financial advisor to determine the best approach for your situation.
About the Author
Joseph M. Favorito, CFP® is a Certified Financial Planner® as well as the founder and managing partner at Landmark Wealth Management, LLC, a fee-only SEC registered investment advisory firm. He specializes in helping individuals and families develop comprehensive financial strategies to achieve their long-term goals.