
The 60/40 portfolio remains one of the most popular balanced investment strategies for individual investors and institutions alike. By allocating roughly 60% to equities (stocks) and 40% to fixed income (bonds and other debt securities), this approach seeks to capture growth from the stock market while using bonds to provide stability and income during market downturns.
But how has this classic mix actually performed over time? A detailed 60/40 annual return decomposition chart, sourced from Bloomberg, FactSet, Haver Analytics, LSEG, and Standard & Poor’s & JP Morgan offers a clear visual breakdown of exactly where returns came from each year, equities, fixed income, or both.
The chart above highlights key historical patterns. Let’s examine what the data means for today’s investors searching for “60/40 portfolio performance,” or “balanced portfolio returns.”
What the 60/40 Return Decomposition Chart Shows
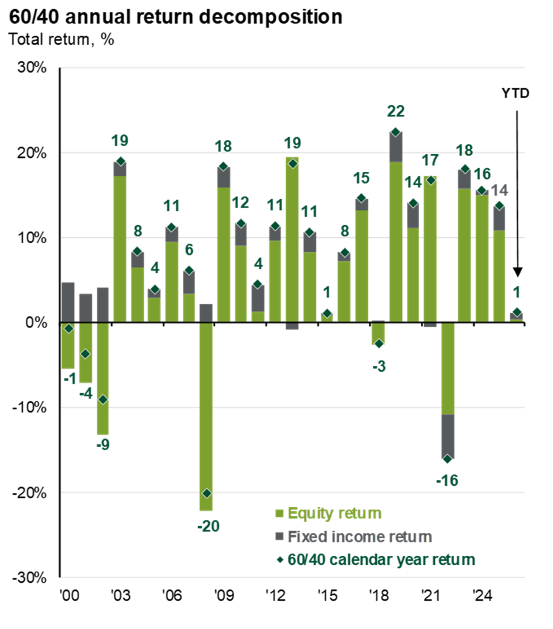
The chart displays total annual returns (in percent) for a representative 60/40 portfolio across selected calendar years from 2000 through February of 2026.
- Green bars = Equity return contribution (60% allocation to stocks)
- Gray bars = Fixed income return contribution (40% allocation to bonds)
- Green diamonds = Total 60/40 portfolio calendar-year return
The stacked bars illustrate how the two asset classes combine to produce the final portfolio result each year. Positive contributions push the total higher; negative ones pull it lower. Data is based on widely followed benchmarks (typically the S&P 500 for equities and a broad U.S. aggregate bond index for fixed income).
Key Insights from the Historical Data
The decomposition makes several important patterns crystal clear:
- Equities Drive Most Upside (and Downside) In strong market years; the green equity bars dominate. For example, the chart shows equity contributions pushing the 60/40 portfolio to double-digit total returns in multiple periods. Fixed-income returns (gray bars) are typically modest in those years, adding a few percentage points of ballast but rarely stealing the show.
- Fixed Income Provides a Cushion — When It Works During equity market stress, bonds often deliver positive returns that offset stock losses. The 2008 bar (labeled with a large negative equity component) shows how fixed income helped limit the overall portfolio decline. This diversification benefit is exactly why many investors love the 60/40 mix.
- Rare Periods When Both Asset Classes Struggle The chart also highlights exceptions. The year 2022 shows a sharply negative fixed-income contribution alongside poor equity performance. The result is a negative total return for the 60/40 portfolio despite the usual diversification. This period coincided with rapidly rising interest rates and inflation, a challenging environment for both stocks and bonds.
- Recent Performance The right side of the chart shows strong equity-driven gains in 2023–2025.
Overall, the chart demonstrates that the 60/40 strategy has delivered positive total returns in the majority of years, with equities providing the growth engine and fixed income reducing volatility.
Why Return Decomposition Matters for Investors
Understanding the equity vs. fixed income return decomposition helps investors answer critical questions:
- Is the 60/40 portfolio still effective in today’s market? With higher interest rates in recent years, bond yields have improved, potentially making the fixed-income portion more attractive than it was during the ultra-low-rate decade.
- How much diversification are you really getting? The chart demonstrates that correlations between stocks and bonds are not always negative. When they move together (as in 2022), the classic 60/40 cushion shrinks.
- What should you expect going forward? Historical data like this is not a guarantee, but it shows the strategy’s resilience across the dot-com bust recovery, global financial crisis, post-pandemic boom, and rate-hike cycles.
Practical Takeaways and Portfolio Considerations
- Rebalancing is key. The 60/40 mix requires periodic adjustment to maintain the target allocation as market values shift.
- Customization options are necessary. Investors all have different goals and objectives and are not all ideally suited for a 60/40 allocation. Variations such to asset allocation can vary widely depending on an investor’s goals, including incorporating alternatives like international stocks, real estate, or commodities for further diversification.
- Risk tolerance matters. The chart’s large negative equity periods (–20% plus range) remind us that even a “balanced” portfolio can experience double-digit drawdowns in severe market stress.
Investors interested in researching “60/40 historical returns,” “balanced portfolio analysis,” or “stock bond allocation performance” may find this portfolio decomposition especially useful because it goes beyond headline total returns to show us why the portfolio performed as it did.
Final Thoughts on the 60/40 Strategy
The chart clearly illustrates both the power and the limitations of the classic 60/40 portfolio. Equities have been the primary driver of long-term growth, while fixed income has repeatedly softened the blow during equity sell-offs, except in the rare synchronized downturns.
Whether you’re a long-term investor reviewing your retirement portfolio or simply researching diversified strategies, this annual return decomposition offers a transparent, data-driven view of how a 60/40 mix has navigated the last two and a half decades of market history, which has had some periods of extreme volatility.
It’s always important to consult your financial advisor to see how the 60/40 approach, or some other variation of an asset allocation will fit your specific goals and risk tolerance. Past performance is no guarantee of future results, but the lessons in this chart remain highly relevant for today’s investors.
About the Author
Joseph M. Favorito, CFP® is a Certified Financial Planner® as well as the founder and managing partner at Landmark Wealth Management, LLC, a fee-only SEC registered investment advisory firm. He specializes in helping individuals and families develop comprehensive financial strategies to achieve their long-term goals.