
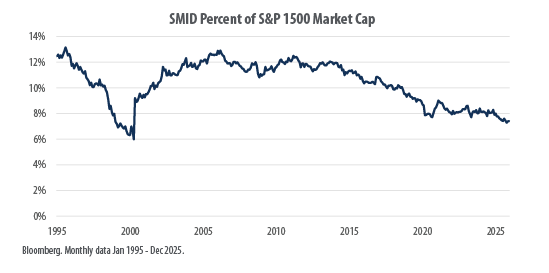
A striking chart sourced from Bloomberg monthly data via First Trust reveals a clear and persistent trend: the share of small- and mid-cap (SMID) companies in the total market capitalization of the S&P 1500 Composite Index has steadily eroded over three decades, reaching historically low levels by the end of 2025 not seen since the year 2000.
The S&P 1500, which combines the large-cap S&P 500 with the S&P mid-cap 400 and S&P small-cap 600, is designed to represent roughly 90% of the U.S. equity market. Yet the portion attributable to SMID stocks has fallen dramatically from peaks near 13-14% in the mid-1990s to just 7.4% by December 2025. This marks one of the lowest points in the dataset, approaching the trough of about 6% seen during the dot-com bubble peak around 2000, and well below the long-term historical average of approximately 10.4%.
The trajectory shows several phases:
- A sharp plunge to lows around 2000 amid the dominance of mega-cap tech names during the internet boom.
- A rebound and relatively stable range of 8-12% through much of the 2000s and early 2010s.
- A renewed and accelerating downtrend starting in the mid-2010s, driven by the extraordinary outperformance of a handful of massive technology and growth companies.
This concentration has intensified in recent years, fueled by several key drivers:
- The explosive growth and market leadership of mega-cap tech/AI giants, which have ballooned in value and index weight.
- Investor preference for “quality” and scale in an environment of geopolitical uncertainty, elevated interest rates, and higher capital costs, factors that favor larger, more resilient balance sheets over smaller firms.
- A broader “winner-takes-most” dynamic in innovation-driven sectors, particularly artificial intelligence and related technologies.
By late 2025, this shift had pushed SMID’s share to a 25-year low. Meanwhile, the top 10 companies in the S&P 500 alone accounted for roughly 38% of that index’s weight, underscoring extreme concentration at the large-cap end.
What This Means for Investors
The trend highlights growing risks from market concentration. Broad U.S. equity benchmarks like the S&P 1500, and other indices such as the total market index or the S&P 500 are increasingly dependent on the performance of just a few outsized names. This leaves portfolios more vulnerable to sector-specific corrections, valuation resets, or shifts in leadership.
At the same time, history suggests the potential for mean reversion. SMID stocks have historically delivered higher long-term returns (albeit with greater volatility) during periods of broader market participation. Early 2026 has shown signs of rotation toward value and smaller names, as investors seek cheaper valuations amid questions about mega-cap sustainability.
The above Bloomberg chart serves as a compelling visual of how market regimes evolve, and a reminder that diversification across market-cap segments remains a prudent strategy, especially when concentration reaches extremes. Whether 2026 brings a continuation of mega-cap dominance or a broadening rally could hinge on economic conditions, interest-rate paths, and the pace of AI monetization.
For those tracking U.S. equities, the message is clear: the “broad market” isn’t as broad as it once was.
About the Author
Joseph M. Favorito, CFP® is a Certified Financial Planner® as well as the founder and managing partner at Landmark Wealth Management, LLC, a fee-only SEC registered investment advisory firm. He specializes in helping individuals and families develop comprehensive financial strategies to achieve their long-term goals.