The Money Supply & Cash on Hand: What does it Mean for Markets?
A review of money market balances has at times been looked at as a measure of whether or not the market is about to see a downward trend or an increase in the near term. The theory is that when there is a large amount of cash on hand, that cash is waiting to be deployed at the right opportunity. When there is less cash on hand, there isn’t enough cash to handle excess selling pressure.
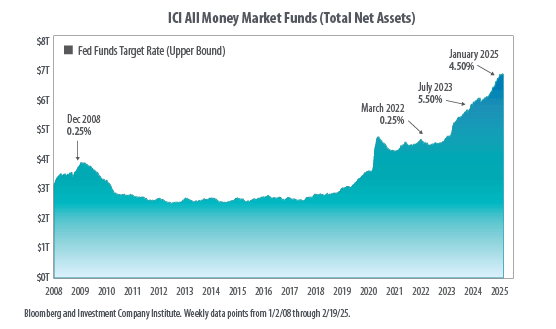
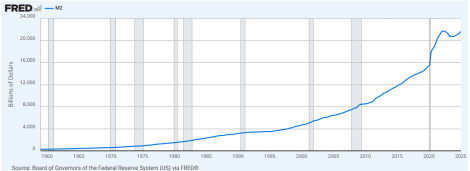
Looking at the chart above from Bloomberg, we can see that money market balances are at a record high in total value. The first thing to note is the explosion in the rate of growth in 2020 as the policy responses to the Covid lock downs began. The M2 money supply increased at an unprecedented rate of 40% in 18 months and continued to grow as seen in the below chart courtesy of the St Louis Federal Reserve. This led to the inevitable outcome of substantially higher inflation. Money market deposits are a component in the M2 measure of the money supply.
Today, money market balances are in excess of 6.9 trillion dollars. This is a 15% increase from this time last year. One might look at that data and extrapolate that we on the cusp of a great market rally. Some of this can be explained by the rapid rate increases in 2022 which caused dollars to begin to flee commercial banks for higher rates in money market alternatives.
A comparison of today versus prior years demonstrates the following:
2000
US GDP = 9.4 trillion
M2 money supply was 7.6 trillion – Approximately 51% of the size of the US economy
Money market balance were 1.8 trillion- Approximately 20% of the size of the US economy
2009
US GDP = 13.7 trillion
M2 money supply was 4.7 trillion – Approximately 55% of the size of the US economy
Money market balance were 3.4 trillion- Approximately 25% of the size of the US economy
2025
US GDP = 29.8 trillion
M2 money supply is 21.8 trillion – Approximately 73% of the size of the US economy
Money Market balances are 6.9 trillion – Approximately 23% of the size of the US economy
What we can see is that while money market balances are quite large, relative to the size of the US economy, they are actually lower than they were in 2009 and slightly higher than in 2000. Obviously, the US economy had just experienced a sizeable contraction in 2009, but on a relative basis, money markets are not that disproportionate to the current size of the economy on a relative basis.
The overall M2 money supply captures not just money markets, but other components such as cash, checking deposits, and other deposits readily convertible to cash, such as certificates of deposit, coins and currency in circulation, traveler’s checks, and savings accounts. When looking at this measure, M2 now amounts to approximately 73% of the size of the US economy, versus 2009 when it was closer to 55% of the US economy.
So, what does this mean? The first and most obvious thing it should mean is that the recent inflation experienced should not have been a surprise to the Federal Reserve or policy makers. The second thing to note is that this is still an elevated level by historical standards. That means that inflation is still a potential risk at those levels.
In terms of whether these historically high money market levels mean a positive or negative for the markets, it seems the answer might indicate a more neutral stance in the shorter term. Markets most certainly have a track record of long-term growth, and we never advocate for clients making financial planning decisions based on a short-term outlook. However, 6.9 trillion in money markets doesn’t have to mean that we are on the cusp of a big market rally in the short run, nor do we have to be. It simply looks like we are at typical levels that we have seen in years past.