S&P Stock Concentration: What Does History Tell Us?

Most investors have heard of market indices such as the S&P 500 or the Dow Jones Industrials, but not all know exactly what that means. Market indices can be constructed differently. But in the case of the S&P 500 index it is a mathematical formula of the top 500 public companies in the United States weighted by market capitalization (cap).
The market cap is determined by multiplying the price of a stock by the number of shares outstanding. This produces market cap numbers in the billions and in some cases trillions when it comes to the S&P 500.
The way in which the S&P 500 is built, the larger the market cap of a particular company, the more proportionate representation they receive in the index. As an example, Microsoft makes up more than 7% of the S&P 500, while a company like Caterpillar makes up less than 0.50% of the index. This means that the more a stock gains in price above the rest of the market, the more it will gain representation in the index. This formula has proven very successful over time, as beating the overall index has been proven to be nearly an impossible feat over any significant length of time.
However, at different points in time, this has led to significant concentrations in a few stocks that have significantly outperformed the overall markets. While that might be a fun ride up, it can lead to some increased risk in a less diversified portfolio.
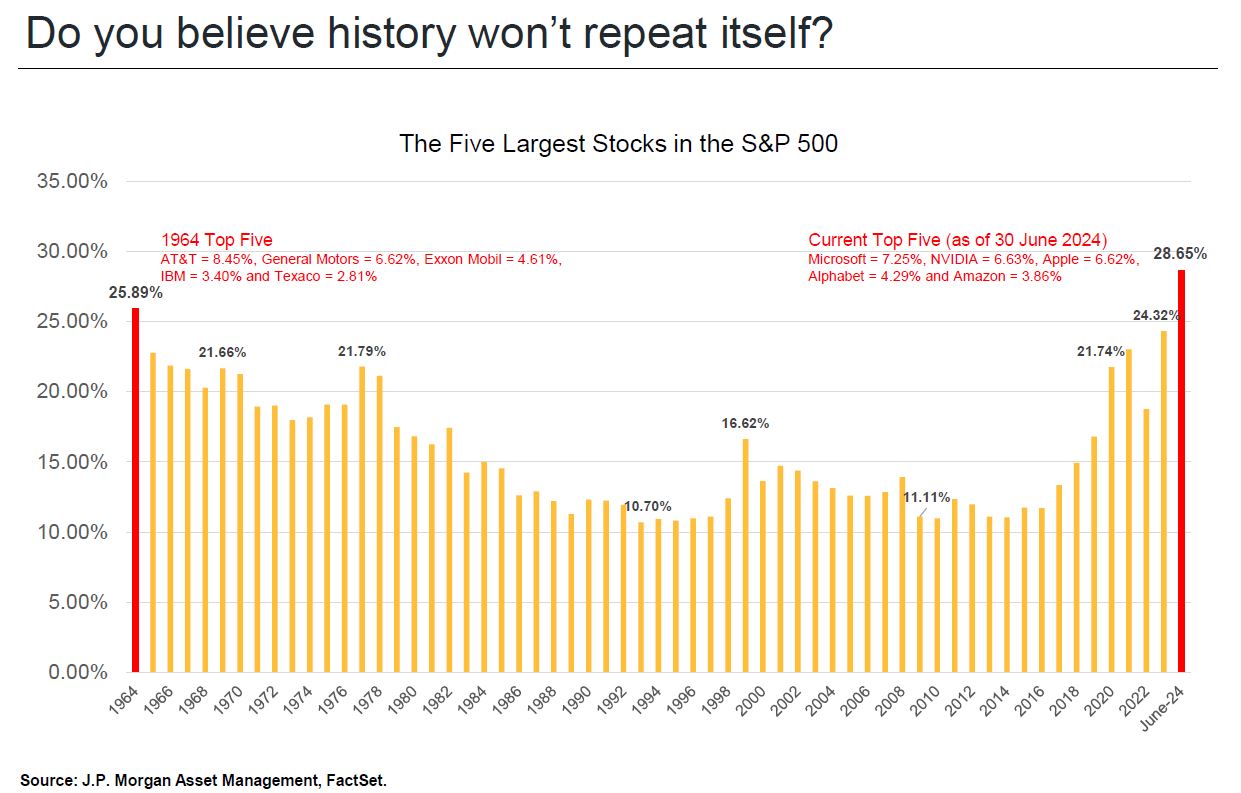
At the moment, we are living through just such a period. As the data provided by JP Morgan demonstrates, the top 5 companies in the S&P 500 make up about 28% of the overall index. That means if you invested $100 dollars in an S&P 500 index fund, $28 dollars would be invested in just those 5 companies, which is less diversified than most might imagine.
This level of concentration has not been seen since the mid-1960’s as we can see from the chart above. The last time this happened, the degree of concentration steadily declined over the next three decades.
In order for this concentration to decline, this means that either those top stocks have to decline, or they grow slower than the remaining companies in the index over time, or some combination of the two. In the long run, typically what happens is the rest of the market begins to catch up. However, in the short term, it could mean that there is an actual price decline in such concentrated holdings.
It’s difficult to predict what the short term will mean for the markets, and even more difficult when evaluating a group of just 5 companies. What we can do is look back at history and see that when a small group of names lead the market in such a significant way, this tends not to be sustainable.
Such data reinforces the need for a well-diversified portfolio that maintains exposure to numerous areas of the markets, including other asset classes. This doesn’t mean that there must be an immediate reversion back to a more balanced index. However, if history is any reliable indicator of what is to eventually come, that seems inevitable, and diversification will become even more important as markets begin to broaden out, and the biggest names do not necessarily continue to remain the leaders.


