Market Valuations
Market valuation metrics are important in setting expectations for returns and for providing us a guide for where we have been. Valuation metrics attempt to quantify (basically assign a number we can use for comparisons) how over or under valued a market might be. Let’s start by discussing these points:
- The stock market is considered a leading indicator.
- An overvalued market can become more overvalued.
- An overvalued market can grow its way to fair value.
- An overvalue market can have a correction.
We will then discuss our current market valuation metrics.
Stock Market is Leading Indicator
The stock market is one of the better leading indicators for the economy. According to Conference-board.org
The ten components of The Conference Board Leading Economic Index® for the U.S. include:
- Average weekly hours, manufacturing
- Average weekly initial claims for unemployment insurance
- Manufacturers’ new orders, consumer goods and materials
- ISM® Index of New Orders
- Manufacturers’ new orders, nondefense capital goods excluding aircraft orders
- Building permits, new private housing units
- Stock prices, 500 common stocks
- Leading Credit Index™
- Interest rate spread, 10-year Treasury bonds less federal funds
- Average consumer expectations for business conditions
As you can see, the stock prices for 500 common stocks provide us more information about the economy. Therefore, there are times the stock market is overvalued and that is an indicator the economy may accelerate (and justify the higher valuation).
Stock Market Can Become More Overvalued
Just because the stock market is slightly overvalued does not meant that it cannot become more overvalued. Further, if an investor says the market is overvalued and goes to cash, the market can continue to go up. If the market continues to go up, it would not be unusual for the underlying fundamentals to improve. When the “overvalued” market corrects, it may not drop down to the value the investor went to cash at because the fundamental underlying improved from that moment in time.
It’s difficult to explain but let’s say the price of a stock is 20 and earnings are 1. That is a 20 P/E. Let’s say a 15 P/E is fairly valued so the price should in theory should be 15. An investor then “sells high” because he thinks it should only be worth $15 because a 15 P/E is the fair value. The price doubles to 40 and the earnings go to 1.75. The stock has become even more overvalued at a 26 P/E. The investor stays in cash due to the stock becoming even more overvalued. Now let’s say the stock corrects and price drops to $25 and the earnings stay at 1.75. The investor see value in the P/E being 14.29 and buys the stock again. So he sold at an overvalued 20 P/E and bought it back at a 14.29 P/E, he had to make money correct? Not exactly, he sold at $20 and bought it back at $25. He is $5 worse off.
The moral of the story, you can lose money by “selling” an overvalued market and waiting for it to become a “better deal”.
An Overvalue Market Can Grow Its Way to Fairly Value
We will again use the P/E ratio and let’s remember the stock market is a leading indicator. If we have an overvalued market, prices can grow less than earning and end up fairly valued. Let’s take the stock in the previous example. If we buy it for $20 when the earning are $1 dollar, we have a 20 P/E. If the price goes to $25 and earnings grow at a faster rate to 1.75, we now have a fairly value stock with a 14.29 P/E.
An Overvalued Market Can Have a Correction
This last point is the one everyone fears and why they might sell when they think the market is overvalued. The perfect example is the dot com bubble. Valuations were at historically rich values and the market corrected by dropping prices. The danger with this reason is that it’s very difficult to know when it will predict a correction in price.
Is the Market Overvalued Now?
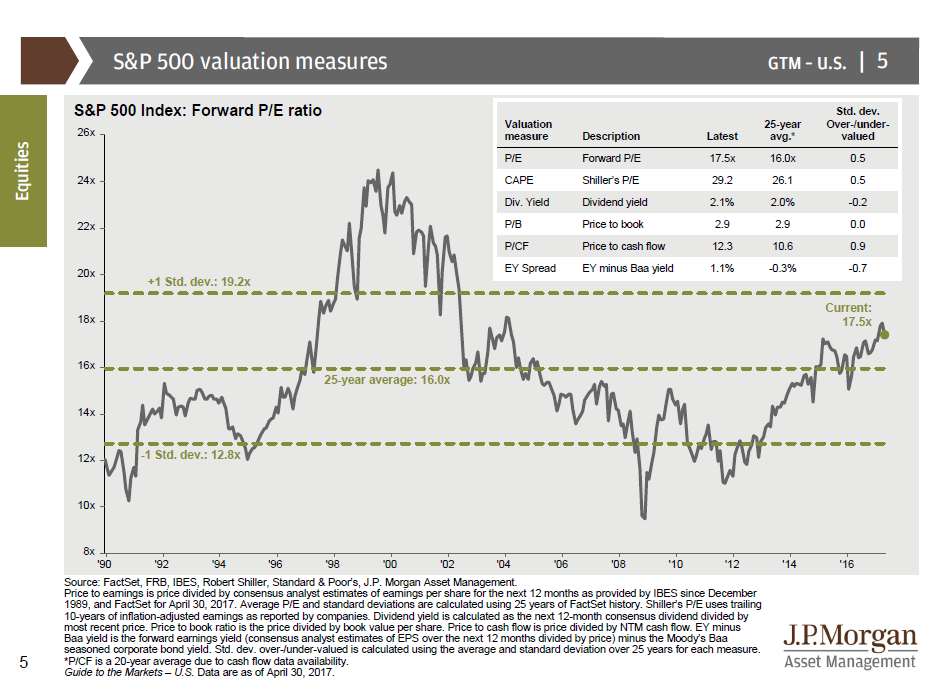
There is a great guide that JP Morgan provides called the guide to the markets. They provide an excellent valuation slide.
(Source JP Morgan’s Guide to the Markets Slide 5)
We have a variety of valuation metrics based on the S&P 500. The third column is “Std Dev.”. We
expect the value to be between 1 and -1, 66% of the time.
Metrics Signaling Over-Valued
P/E – This measure is simply the price of the S&P500 divided by the projected earnings. Currently, this measure says the market is slightly overvalued as a 0.5
CAPE – This measure is the cyclically adjusted P/E or Shiller’s P/E. This measure takes the average of the past 10 years of earnings. Currently, it also indicates the market may be slightly overvalued at 0.5
P/CF – Price to Cash Flow metric is the price divided by the cash flow of the company. The metric is currently at 0.9 which signifies an overvalued market
Fair Value
P/B – The price of the stock dividend by the “book value” or the value of the stock held on the
accounting books of the company based on historical accounting data. Currently, its standard deviation
is 0.0 indicating Fair Value.
Metrics Indicating Undervalued
Dividend Yield – This measure is the dividend of the stock divided by the price. At a -.02, the dividend
yield is indicating a slightly undervalued market.
EY Spread – This measure takes the earnings yield of stocks minus the yield on Baa corporate bonds.
The current standard deviation of -0.7 indicated an undervalued market.
The Take Away
So we reviewed how even an overvalued market can become fairly valued a variety of ways and we also reviewed what our current metrics are telling us about the S&P500. The next question is, “Is the market fairly valued”? With the current metrics, you can make an argument for overvalued, fairly valued, and undervalued. My opinion? I do not feel the current metrics are strong enough to form a strong enough opinion worth acting on. Given the wealth of information out there and how implementing what might sound like a great strategy on what you read in Baron’s magazine or hear don CNBC, its important to partner up with an expert like Brian Cohen at Landmark Wealth Management LLC.
About The Author
Stephen Reh CFA, MBA, CFP® is a financial planner in Southern California. Steve founded www.investwithsteve.com and Reh Wealth Advisors LLC in 2010 to provide fee only asset management and financial planning.