Market Corrections: How Much Impact Do They Have?
As investors work their way through the latest round of market volatility, this time driven by the recent fear of the “Corona Virus”, a number of fears often arise from investors. Questions such as:
Is it different this time?
Do I have time to recover now that I’m retired?
How long does it take to make my money back?
These are common questions which are not unique to this particular market downturn. And each one has an answer.
Is it different this time?
The answer is a resounding YES! It is always different. However, as Sir John Templeton said, the four most dangerous words in investing are “this time it’s different”. Each market correction and bear market is driven and preceded by a different series of events. The 1920/21 crash, the crash of 1929, the Stagflation of the 1970’s, Black Monday 1987, the tech wreck of 2000, 2008 financial crisis, or the Ebola scare of 2014.
Such events have in some instances led to a recession, and some were a mere short-term downturn. Yet, it is always different. Different does not necessarily imply it is worse. Different does not by any means suggest markets won’t recover. Ultimately, the stock market is little more than a collection of many different businesses. The longer-term price of a stock is dictated by profits. How profitable a company is and is expected to be in the future will determine the company’s stock price. While an individual company can certainly fail, over the long term, markets as a whole will continue to grow profits given enough time. As a result, markets continue to grind higher given enough time.
Do I have time to recover now that I am retired?
The answer to this is typically yes. It’s important to remember that retirement does not mean that you are going to spend all of your money on day one of retirement. If that were the case, then market volatility would be the least of your concerns. A typical retiree in their mid-60’s may very well live into their 90’s. As a result, we generally suggest projecting a financial plan to as old as age 95. If you entered the labor force at age 21 and retired at 65, that’s 44 years you have been saving for retirement. However, you may very well live another 30 years in retirement. Over that time, you may see a significant amount of erosion of your purchasing power via inflation. Presuming that you are spending through assets at a reasonable pace, and also using a well-diversified balanced portfolio, you not only have time to recover…but will see many market corrections and several bear markets over that time period.
How long does it take to make my money back?
The answer to this depends on the degree of portfolio risk you introduce. An investment portfolio that is 100% in the stock market would inherently take on more risk, and likely higher longer-term returns. However, having 100% of your portfolio in stocks is typically not prudent for most retirees, or most investors in general. Particularly if there is an income need at hand. As a result, it is more practical to look at a more common allocation seen by the typical investor entering retirement.
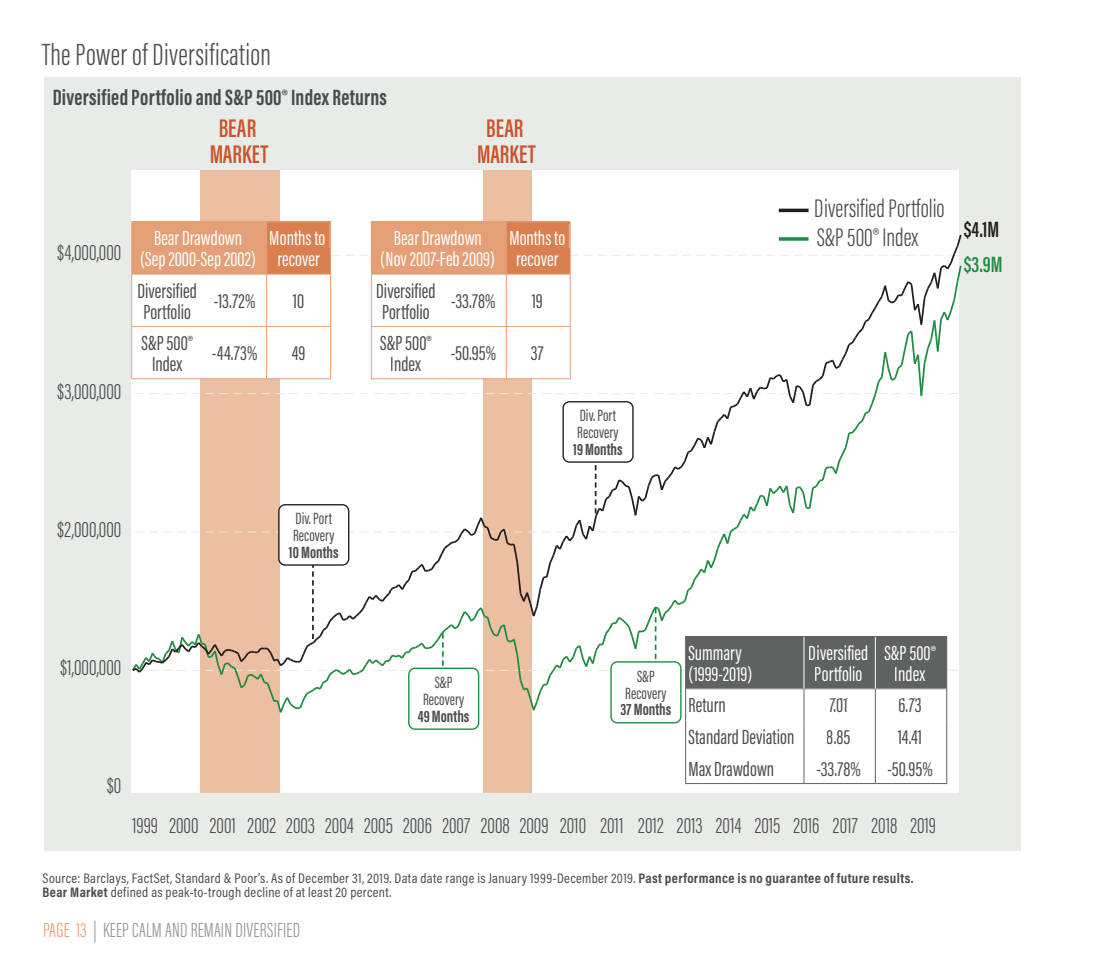
An investor that has a diversified asset allocation that allocates 60% of a portfolio to stocks, and 40% to fixed income investments is one of the most common allocations seen by the typical retiree looking to draw an income over a 30-year period. We call this a balanced allocation. So, what can you expect with such an allocation? The chart above provided by AMG gives some historical perspective on the impact of substantive market declines.
Looking at the 2008 financial crisis, which was one of the worst in market history (beginning in October of 2007 through March of 2009), a balanced portfolio would have taken approximately 19 months to return to its prior peak value from the bottom of the markets. In terms of its impact on a financial plan, this was very manageable.
During the 2000 technology bubble implosion, compounded by the September 11th attacks of 2001, (beginning in September 2000 through September 2002), US markets saw three consecutive negative years, which is relatively rare. Yet, it took only 10 months for a balanced portfolio to recover from the bottom of 2002. Also quite manageable.
In each instance, for a portfolio that was 100% in stocks, it took significantly longer to reach the previous peak. That was approximately 37months after the financial crisis and 49 months after the bursting of the technology bubble/9-11 attacks. This data lends itself to the importance of having the correct asset allocation that matches your risk tolerance an income needs, as opposed to putting all your money in stocks, or any individual company.
Remember that a loss of -10% requires an 11% return to breakeven. Steeper losses, such as a -40% decline requires a return of 67% to breakeven. A -50% loss requires a return of 100% to breakeven.
Additionally, this data also presumes that an investor stays invested all the way though these periods without attempting to time market movements, or selling out of fear and panic. Staying invested all the way through is vital to your success as an investor. Looking at the S&P 500, simply missing just the best 25 days over the course of the last 20 years is the difference between having a consistent return, and actually producing a net negative return over 20 years.
All of this data demonstrates that it pays to stick to the plan. Yes, this time is different. But so will next time, and the time after that. Yet, each new market bottom is consistently higher than the previous bottom, and each new peak is higher than the previous peak…as markets continue to grind higher over the long term. While history does not repeat itself precisely, history is an excellent guide for investors.